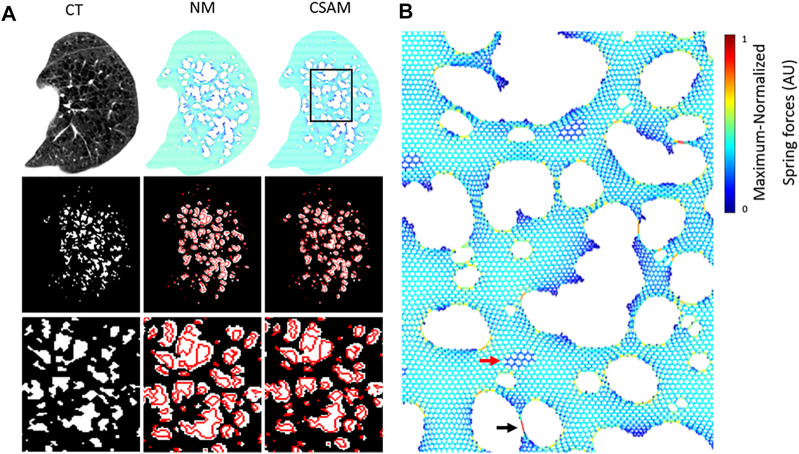
FIGURE 4.
(A) Original CT from a patient and examples of mapping to spring networks using the naïve method (NM) and the Curvature and Size Adjusted Method (CSAM). The left column displays the CT scan of an emphysema patient (top), the binary low attenuation area (LAA) map obtained by thresholding at −960 Hounsfield Unit (middle), and a zoomed-in region of the LAA map (bottom). The middle and right columns represent the same content for two spring networks constructed from the CT image with the NM and CSAM. The red lines represent the boundaries of LAA clusters on the original CT. (B) Zoomed-in version of the rectangle on the CSAM network in (A). Colors are proportional to force. The black arrow points to narrow bridge carrying a high force whereas the red arrow marks a region of high attenuation.

