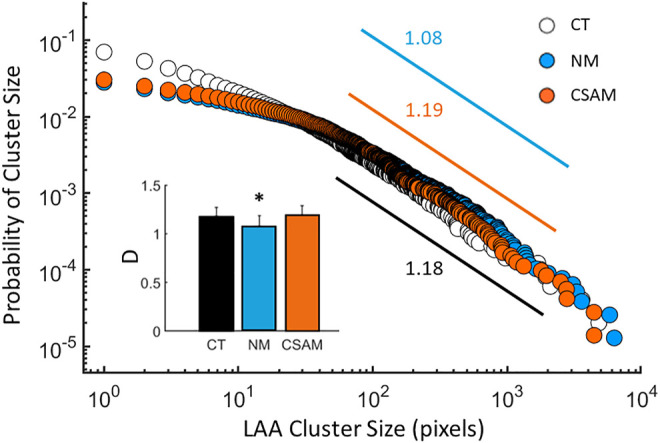
FIGURE 6.

The distribution of low attenuation area (LAA) clusters computed from the CT images of 7 subjects (open circles) and reconstructed with the naïve method (NM, blue) and the Curvature and Size Adjusted Method (CSAM, red). The exponents, defined as the negative slopes, are given next to the regression lines between pixel values of 50 and 1,000. Inset: Mean and estimated standard deviation of the exponents of LAA cluster distributions. The * indicates p<0.05 compared to the CT value.
