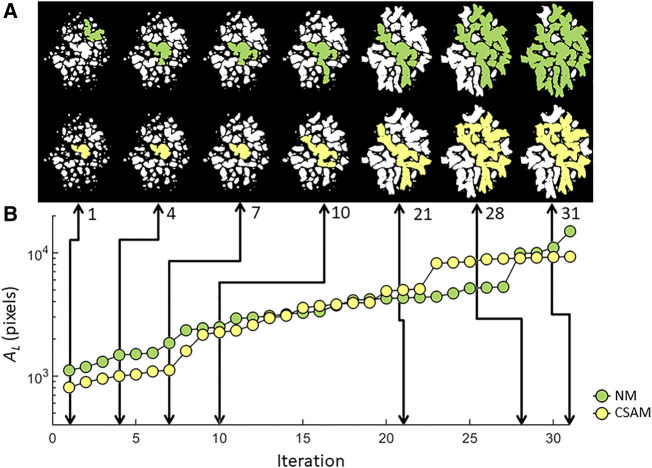
FIGURE 9.
LAA configurations (A) and the evolution of the largest LAA cluster (B) traced through simulated network breakdown in two spring networks constructed with NM or CSAM using the same patient CT image. Note that even when the largest clusters have similar size (iterations 1, 10 and 20), their morphological difference is apparent.

