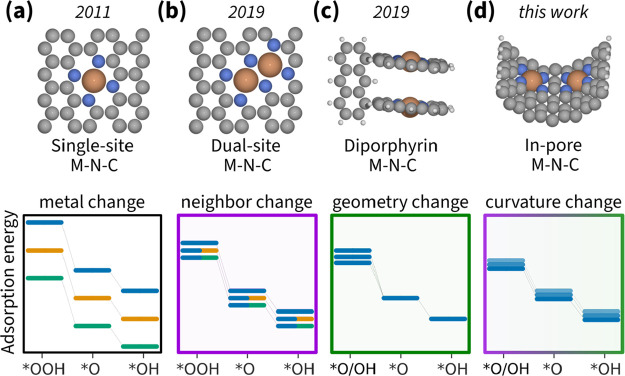
Figure 1.
Timeline of the M–N–C model development. The adsorption energies of intermediates vary with changing (a) M in the flat single-atom site model,15 (b) second M in the flat dual-atom site model,16 (c) geometry of the diporphyrin model,23 and (d) surface curvature of the in-pore model. Line color indicates a different M, line transparency indicates distinct geometry.

