Figure 4.

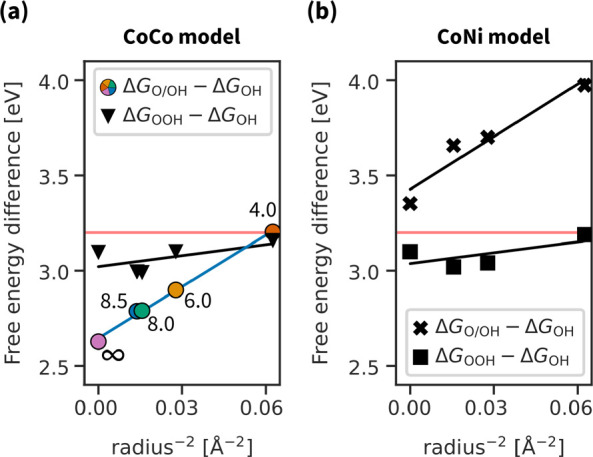
Linearized plot of free energy differences vs the intersite distance which is expressed as r–2. Using colored points as a reference, the pore radius of the CoCo model is respectively ∞, 8.5, 8.0, 6.0, and 4.0 Å from left to right.

Linearized plot of free energy differences vs the intersite distance which is expressed as r–2. Using colored points as a reference, the pore radius of the CoCo model is respectively ∞, 8.5, 8.0, 6.0, and 4.0 Å from left to right.