FIGURE 5.
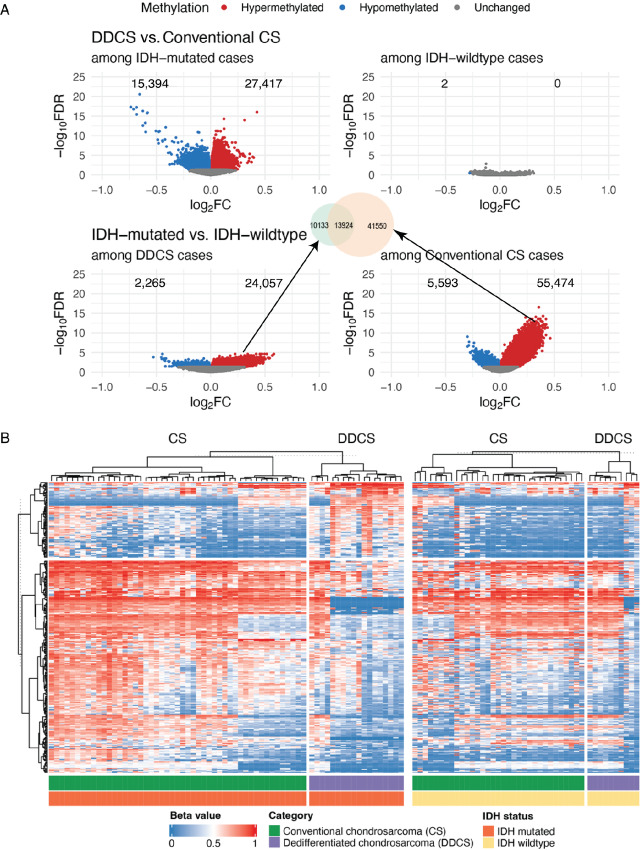
IDH-associated methylation in DDCS. Differential methylation analysis of DDCS versus conventional CS adjusted by IDH mutational status was performed. Methylation profiles of 94 conventional CS and 33 DDCS cases detected by the Illumina 450k or EPIC methylation array platforms, including cases from the MSKCC cohort, and external data from Nicolle 2019 and Koeslche 2019, were retrieved. Differential methylation analysis was performed on CpG sites between DDCS and conventional CS cases within IDH-mutated and IDH-wildtype groups. A, Volcano plots showing −log10 (FDR) against log2(fold change, FC) comparing methylation in DDCS versus conventional CS among IDH-mutated and IDH-wildtype cases, and IDH-mutated versus IDH-wildtype cases among DDCS and conventional CS. Differentially methylated sites are highlighted in red (hypermethylated) and blue (hypomethylated), respectively. FDR: false discovery rate (adjusted P value corrected by the Bonferroni–Holm method). FC: fold change. B, Heatmap represents beta values (ratio of the methylated probe intensity to the overall intensity—sum of methylated and unmethylated probe intensities) of the top 100,000 more variable CpG sites clustered by CS type and IDH1/2 mutational status.

