FIGURE 7.
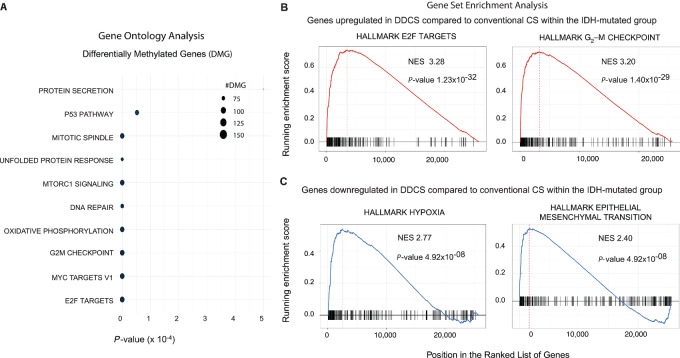
Pathway analysis of differentially methylated and expressed genes in DDCS compared with conventional CS. A, Gene ontology analysis of differentially methylated CpG sites (DMG) in DDCS versus conventional CS within the IDH-mutated grouop. Dot plot shows the pathways denoted by the significant gene sets. P values were adjusted by the Benjamini–Hochberg correction method. B and C, GSEA of differentially expressed genes in DDCS versus conventional CS within the IDH-mutated group. Shown are the top pathways for genes upregulated (B) and downregulated (C) in DDCS compared with conventional CS. P values were adjusted by the Benjamini–Hochberg correction method.

