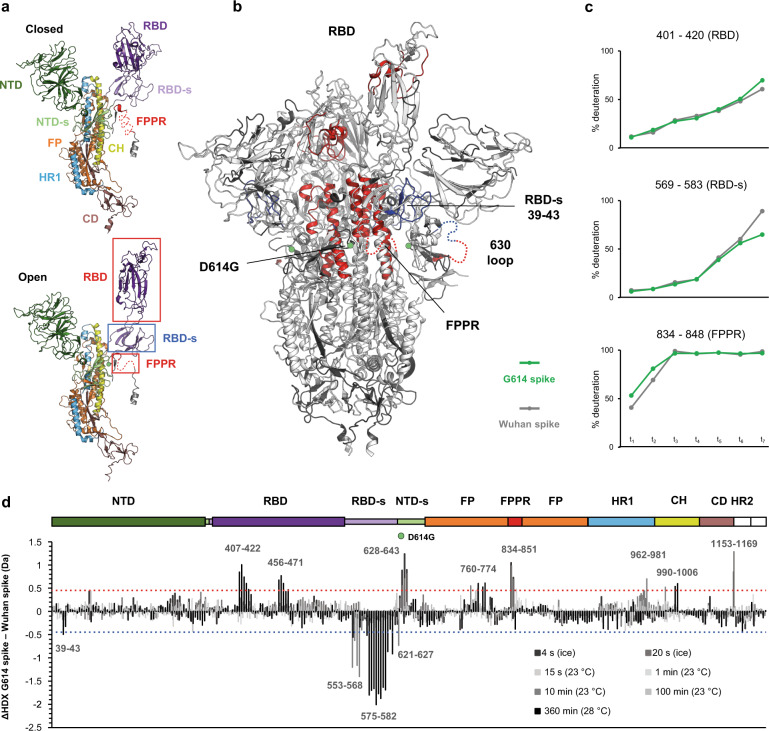
Fig. 1. Differences in structural dynamics between Wuhan (D614) spike and G614 spike.
a A single monomer in closed (top) and open (down) conformation is represented (PDB: 7bnn18), with individual domains of spike indicated. b Regions with differences in HDX are superimposed on the structure of G614 spike with one RBD erected (PDB: 7bnn18), coloured in red for increased dynamics and in blue for reduced dynamics. Regions not mapped in the structure and showing HDX effects are inserted as dashed lines in one single protomer. c Uptake plots of model peptides of the allosteric axis (FPPR – RBD-s – RBD) that regulates the closed-to-open state transition. d Differential plot illustrates the difference in HDX (ΔHDX) between G614 spike and Wuhan spike across the time points studied. The dashed red light indicates the threshold of significance for increased HDX; the dashed blue line indicates the threshold of significance for reduced HDX. The spike domains are illustrated in the top bar and the green sphere is positioned at the level of the D614G substitution.

