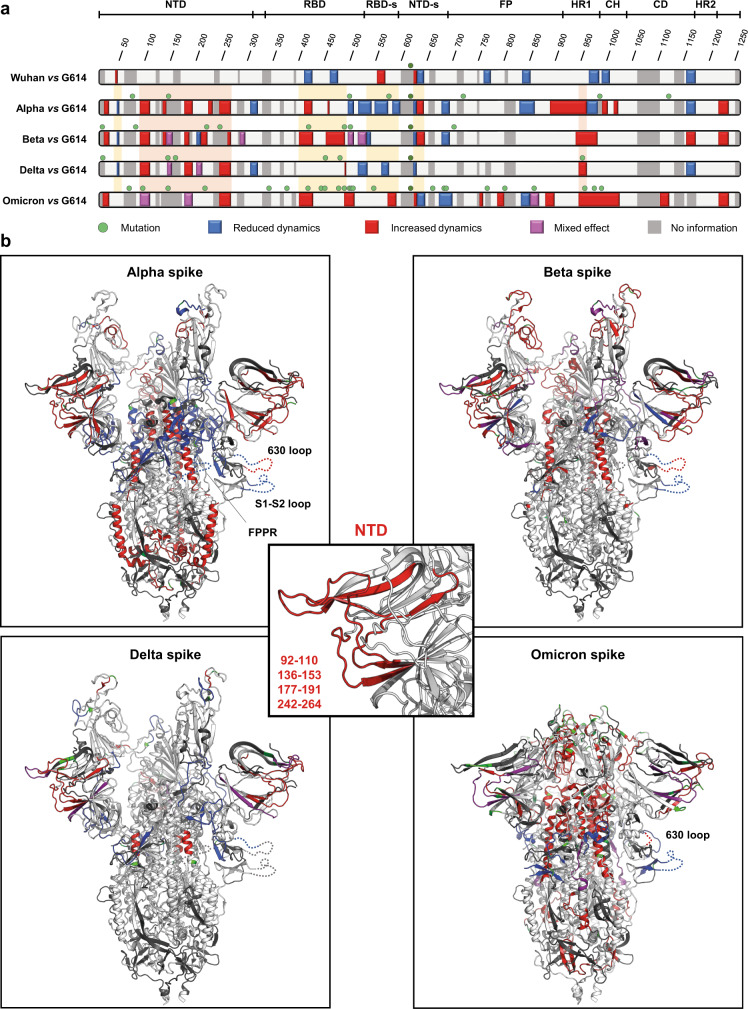
Fig. 2. Conformational evolution of spike.
a Map of HDX effects. Regions of various spike trimers with a significant difference in HDX compared to G614 spike are coloured along the spike sequence. In red: increased HDX; in blue: decreased HDX; in magenta: mixed effect; in light grey: no difference in HDX; in dark grey: no information; green spheres: sites of amino acid changes. Yellow rectangles frames regions reporting on a modulation of closed/open state. Orange rectangles frames regions of HDX effects in common among the various spike trimers. b HDX effects are superimposed on the structure of G614 spike with two erect RBDs (PDB: 7bno18) for alpha, beta and delta spikes, and on the structure of D614 spike in closed conformation (PDB: 6zge11) for omicron spike. Regions not mapped in the structure and showing HDX effects are inserted as dashed lines in one single protomer. Sites with amino acid changes are coloured in green. In the central panel, conformational effects in common among spike variants are superimposed on the NTD subdomain.

