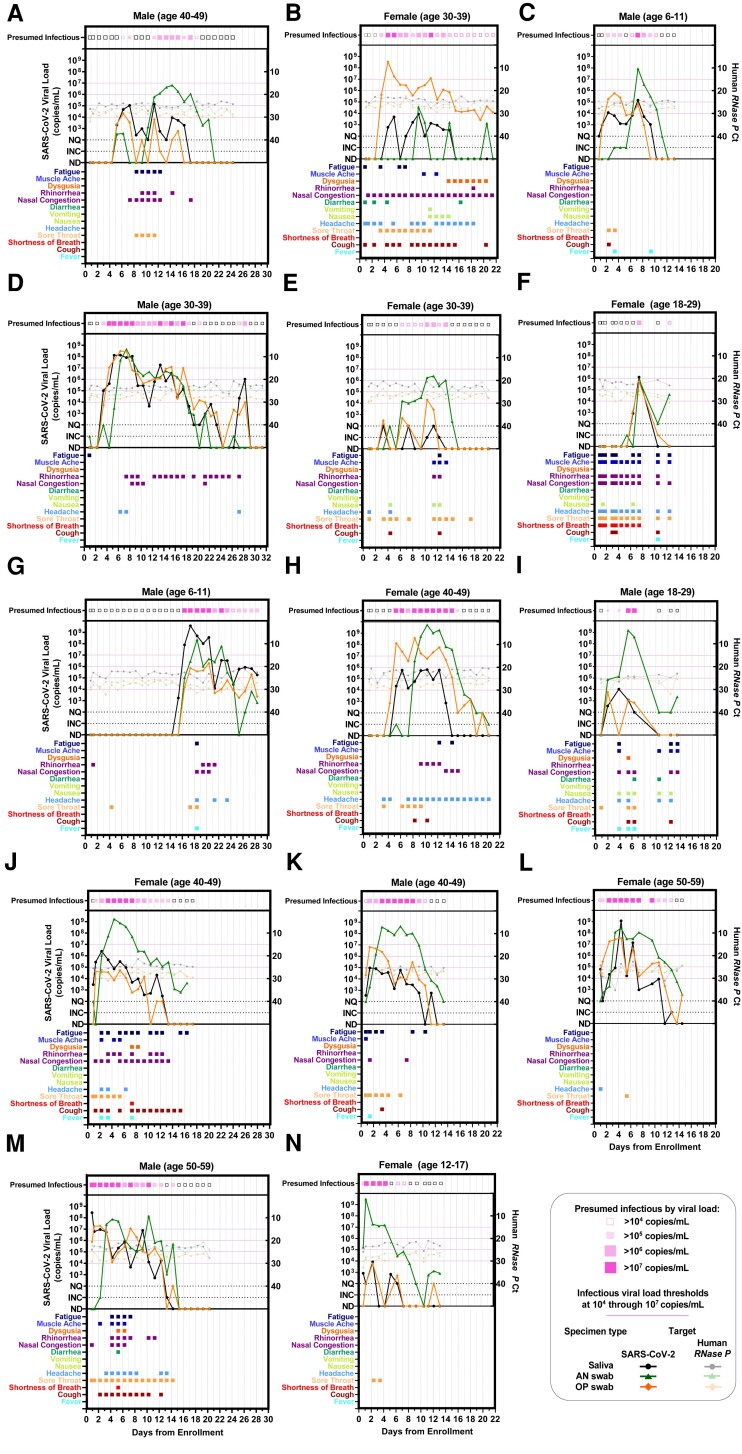
Fig. 2.
Individual viral-load timecourse measurements from 14 participants enrolled at or before the incidence of acute SARS-CoV-2 infection. Each panel (A–N) represents a single participant throughout the course of enrollment. Each panel plots SARS-CoV-2 viral-load measurements (left y-axis) and human RNase P Ct values (right y-axis). Line colors indicate specimen type: black/grey circles are saliva, green triangles are anterior-nares (AN) swabs, and orange diamonds are oropharyngeal (OP) swabs. Timepoints at which at least one specimen type had presumably infectious viral load (>104–107 copies/mL) are indicated at the top of each plot. Colored boxes below each plot indicate the symptoms reported at each sample-collection timepoint. Each of the 14 participants collected three specimen types throughout the course of acute infection, resulting in 42 viral-load timecourses. Participants collected an average of 15 (±5 SD) daily timepoints. ND, not detected; INC, inconclusive result; NQ, virus detected, however, viral loads below the test LOD (250 copies/mL) and thus not reliably quantifiable for RT-qPCR measurements.

