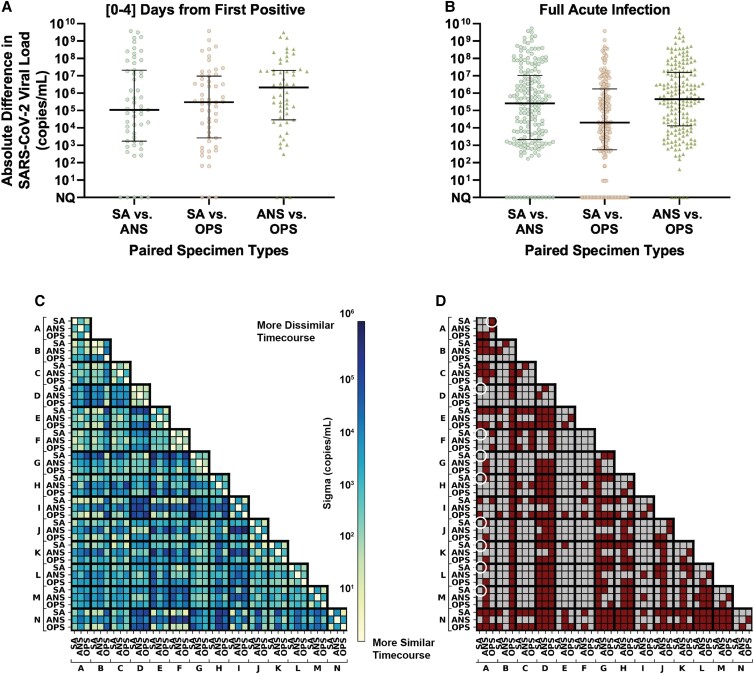
Fig. 3.
Extreme differences in viral loads across specimen types collected from the same person at the same timepoint for the 14 participants enrolled before or at the incidence of acute SARS-CoV-2 infection. A, B) Absolute differences in viral loads across paired specimen types were calculated as the absolute value of viral load in one specimen type minus another from the same participant at the same specimen-collection timepoint. Black lines indicate median, with interquartile range. Differences are shown for: A) 55 timepoints collected in the first 4 days from the incidence of infection (first positive specimen of any type) in each participant and B) 186 timepoints collected throughout the entirety of acute infection (at least one specimen type from the participant at the timepoint was positive and had quantifiable SARS-CoV-2 viral load; 11 timepoints were positive but not quantifiable). C) Correlation of viral-load timecourses, measured as the standard deviation across paired viral-load timecourses, assuming Gaussian-distributed noise (see Methods “Comparison of Viral-Load Timecourses Across Specimen Types”). D) Statistical significance of the difference in viral-load timecourses between specimens and between participants. Statistically significantly different timecourses are represented as red cells and nonsignificant comparisons are grey. White circles are called out as examples in the text. Expected sampling noise was estimated by analyzing RNase P Ct data from our study (Fig. S4) and from Levy et al. (63). P-values were obtained by comparing residuals from observed data and expected sampling noise. Additional method details are shown in Fig. S5. SA, saliva; ANS, anterior-nares nasal swab; OPS, oropharyngeal swab. Participant labels match Fig. 2 panels (A–N).

