. 2023 Jan 19;23(6):1432–1466. doi: 10.1039/d2lc00799a

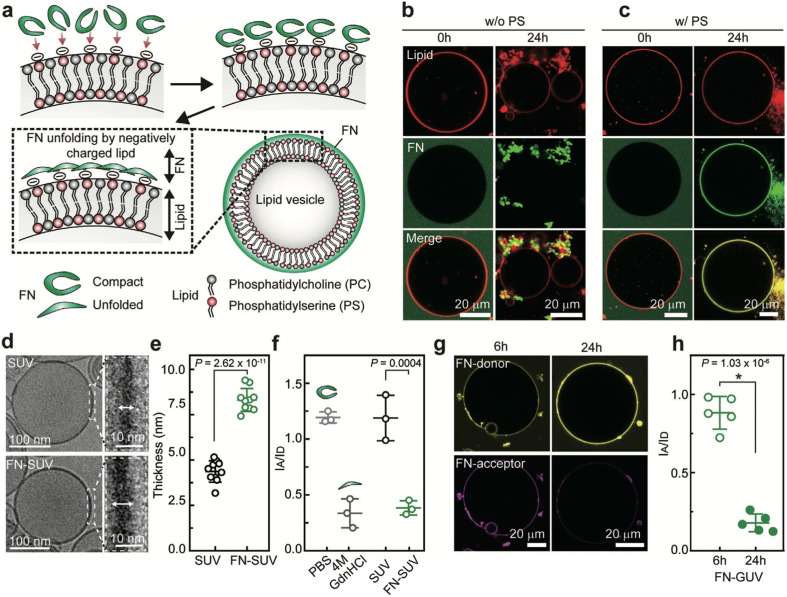
Fig. 7. A schematic representation of conformational changes of FN upon adsorption on negatively charged vesicles. a) Demonstrating how negatively charged surfaces of vesicles induce binding and subsequent stretching of FN. b and c) Confocal images of GUV-FN binding; FN tends to form insoluble aggregates on the surface of neutral GUV (b); FN tends to attach evenly on the surfaces of negatively charged GUVs (c). d) Cryo-TEM images of an SUV and its membrane without FN (upper picture) and after incubation with FN (lower picture). e) Indicating a significant increase in the thickness of the SUV membrane after FN incubation. f) FRET data showing the intensity ratio of IA/ID for double-labeled FN diluted in PBS, 4 m GdnHCl, or sucrose, or incubated with SUVs. IA and ID are the acceptor and the donor fluorescence intensity, respectively. g) Confocal imaging of single-vesicle FRET reveals the donor and acceptor intensities in GUVs after 6 and 24 hours of incubation with FN. h) Single-vesicle FRET demonstrating the intensity ratios IA/ID after 6 and 24 hours of incubation with FN and GUVs. Reprinted with permission from ref. 233. Copyright 2021. John Wiley & Sons.

Fig. 7