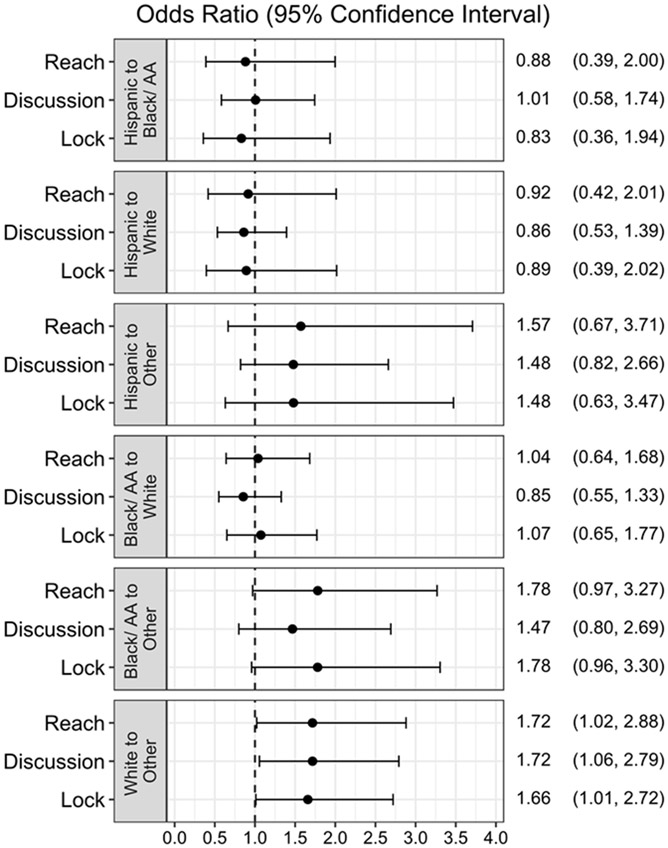
Figure 2. Comparison of adjusted odds of S.A.F.E. Firearm delivery between racial and ethnic groups.
Odds ratios represent the rate of delivery for Group 1 relative to Group 2. Adjusted odds ratios for each outcome are estimated using a GEE model that includes covariates for site, medical complexity, race and ethnicity, and sex. Type III tests for race and ethnicity were nonsignificant for reach, discussion, and lock models (p-values = 0.196, 0.180, and 0.205, respectively).
Non-Hispanic (NH) label was removed to promote clarity.

