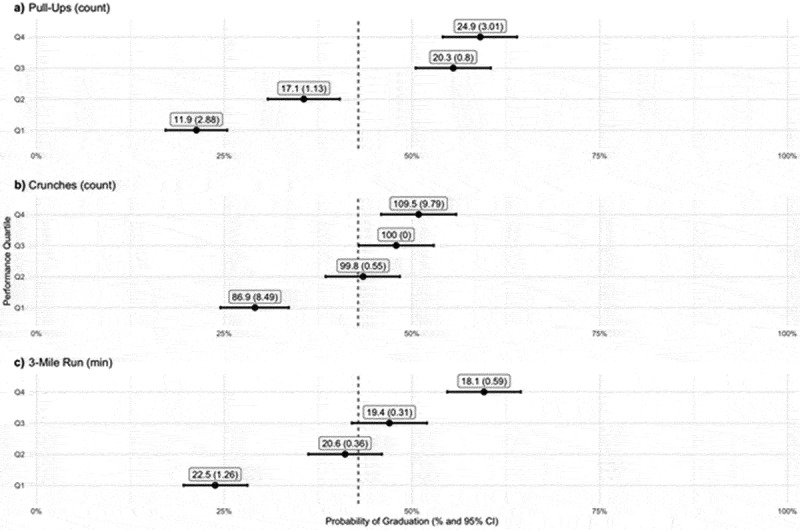
Figure 2.

Probability of graduating the marine reconnaissance basic primer course according to physical performance predictors. Dotted line reflects the average probability of graduating. Points and error bars represent the probability of selection for each performance quartile with 95% confidence interval. Text labels show the mean and standard deviation of the performance for each quartile. (a) Pull up count, (b) number of crunches, (c) Run time minutes displayed in reverse order since lower quartiles correspond to faster times metric.
