
Figure 4:
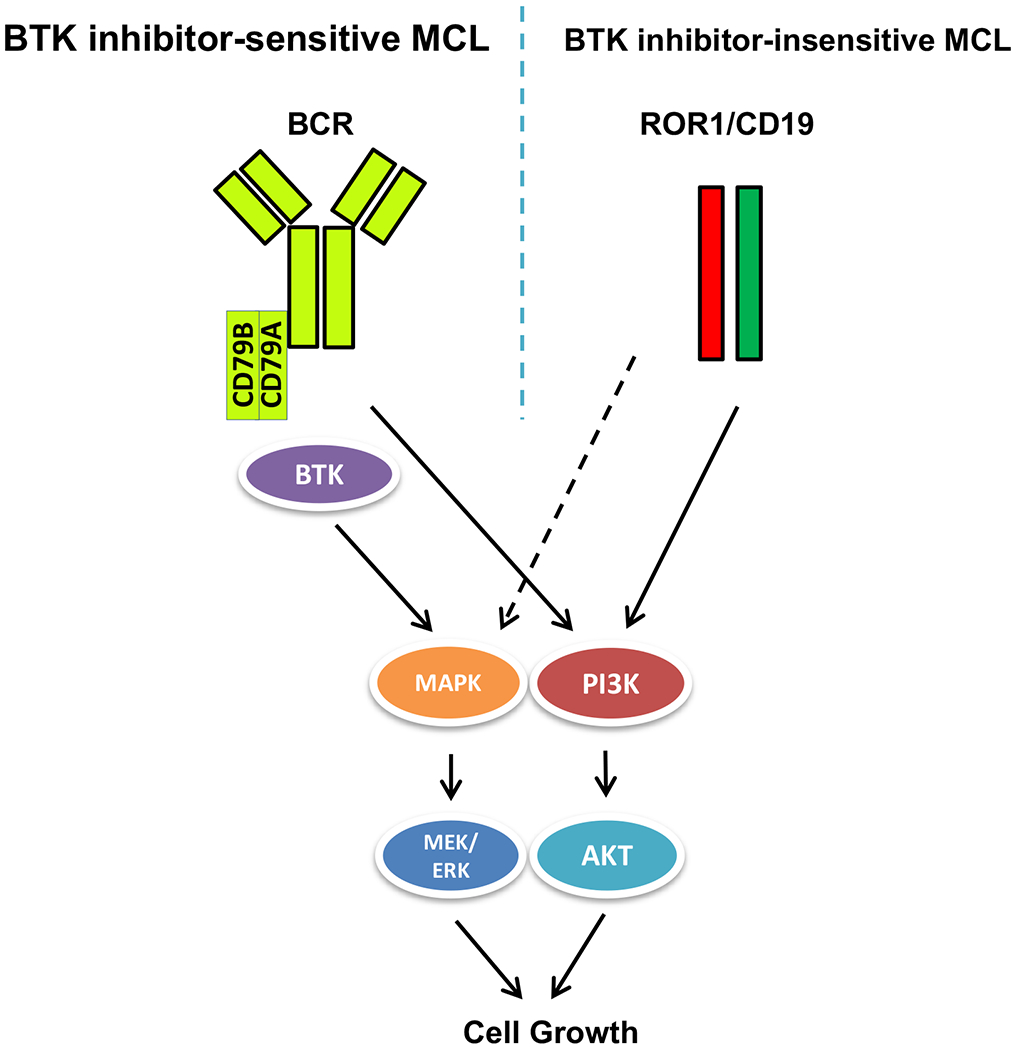
Schematic diagram of BCR/BTK- and ROR1/CD19-activated cell signaling pathways in BTK-sensitive and –resistant MCL cells.
Official websites use .gov
A
.gov website belongs to an official
government organization in the United States.
Secure .gov websites use HTTPS
A lock (
) or https:// means you've safely
connected to the .gov website. Share sensitive
information only on official, secure websites.
Schematic diagram of BCR/BTK- and ROR1/CD19-activated cell signaling pathways in BTK-sensitive and –resistant MCL cells.