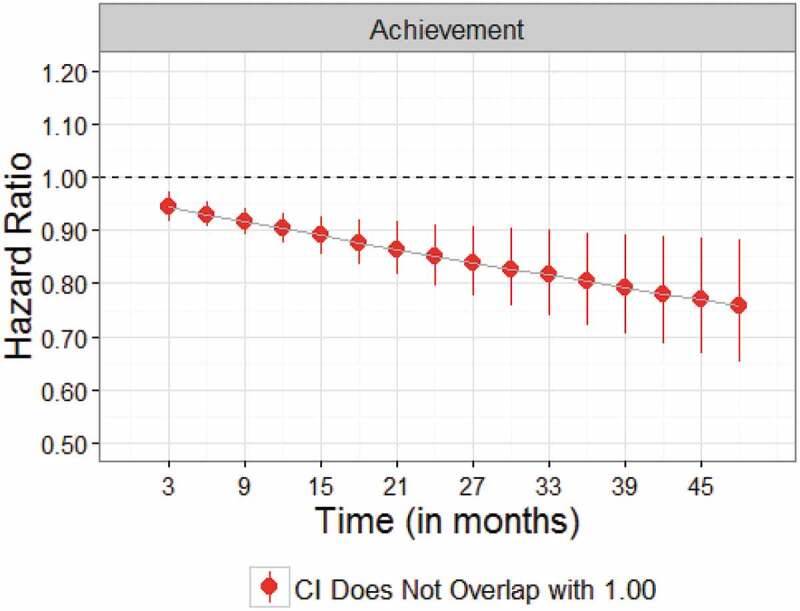
Figure 4.

Time-varying effects from the proportional hazards regression model of performance-related attrition. Red circles represent significant effects; gray circles represent non-significant effects (p < .05). Vertical lines extending from circles represent standard errors.
