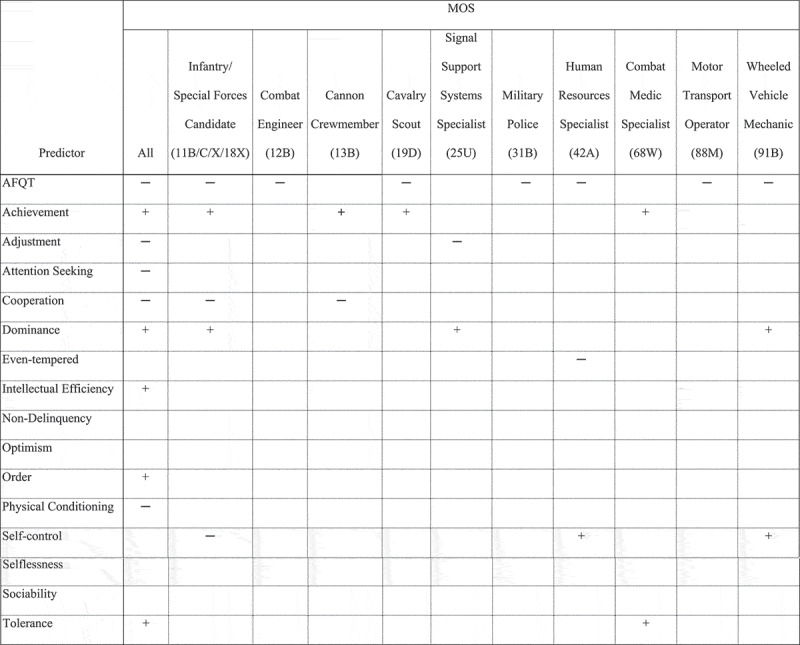
Figure 7.

Sample sizes (n) are as follows: All = 35,884; 11B/C/X/18X = 7,971; 12B = 979; 13B = 1,144; 19D = 1,760; 25U = 511; 31B = 442; 42A = 438; 68W = 2,062; 88M = 1,056; 91B = 1,773. TAPAS predictors of reenlistment from logistic regression analyses by MOS. Dashes (–) indicate a negative effect. Pluses (+) indicate a positive effect. Empty cells indicate no effect. All effects are significant, p < .05. No predictors were significant in the culinary specialist (92G) sample (n = 769).
