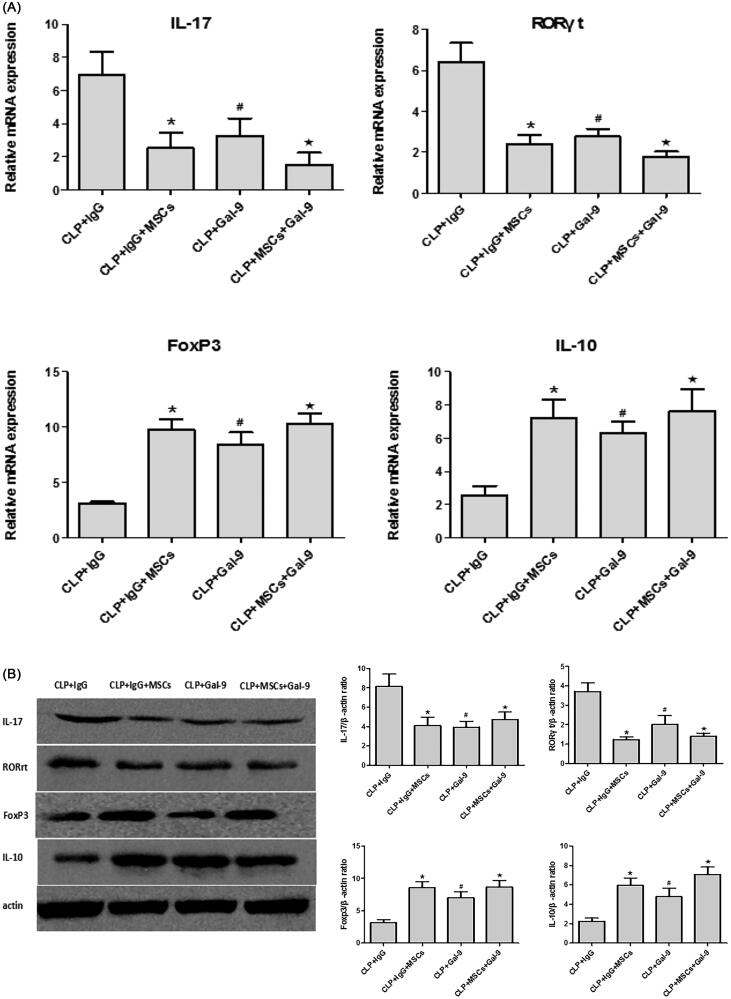
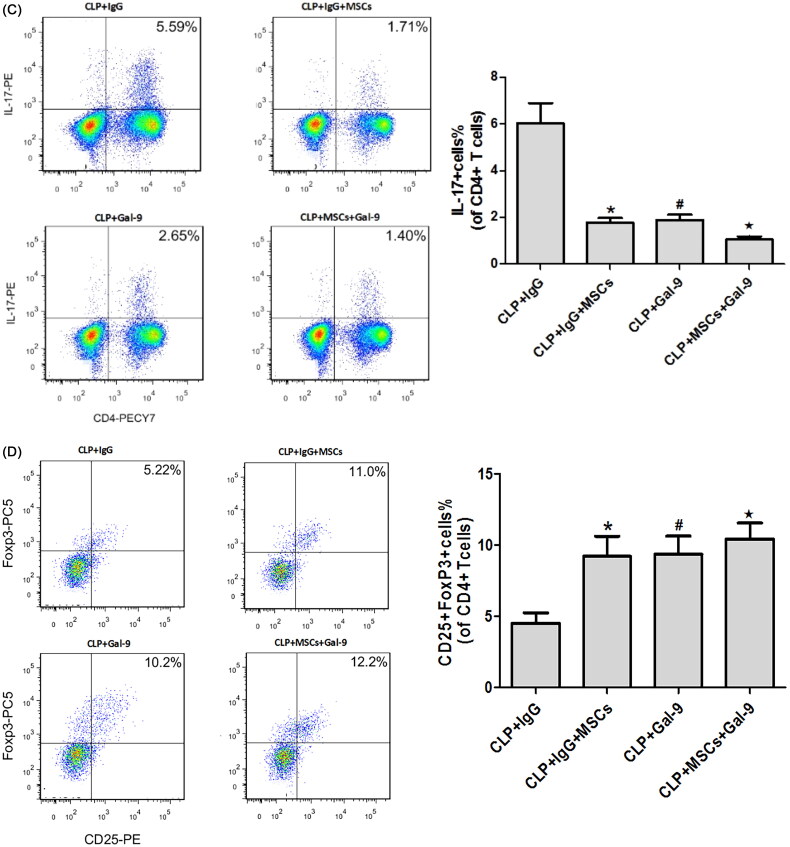
Figure 4.
(A) The mRNA expression of IL-17, RORγt, FoxP3 and IL-10 in kidney tissues 24 h after CLP operation. compared with CLP + IgG group, *p < .05, #p < .05; compared with the CLP + Gal-9 group, ★p > .05. (B) The Western blotting expression and quantitative analysis of IL-17, RORγt, FoxP3 and IL-10 in kidney tissues. The protein levels are presented as mean ± SD. compared with CLP + IgG group, *p < .05, #p < .05; compared with the CLP + Gal-9 group, ★p > .05. (C) The percentage of Th17 cells relative to CD4+ T cells were measured by flow cytometry after the preparation of single-cell suspensions. the values are mean ± SD. Comparisons between groups were performed using Student t-test. compared with CLP + IgG group, *p < .05, #p < .05; compared with the CLP + Gal-9 group, ★p > .05. (D) The percentage of Treg cells relative to CD4+ T cells were measured by flow cytometry after the preparation of single-cell suspensions. the values are mean ± SD. Comparisons between groups were performed using Student t-test. compared with CLP + IgG group, *p < .05, #p < .05; compared with the CLP + Gal-9 group, ★p > .05.


