Fig. 1.
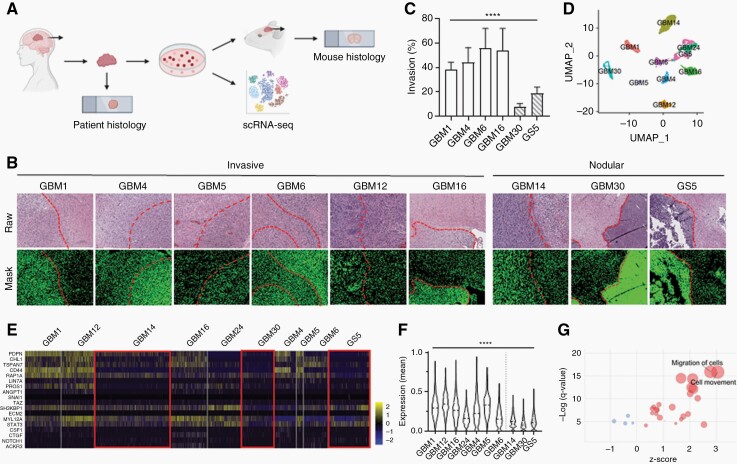
Histopathological and scRNA-seq analysis identify two cohorts of GBM samples with distinct phenotypes, invasive and nodular.
(A) Schematic of data collection from human GBM histology samples, PDX mouse GBM histology samples, and scRNA-seq data. (B) Human and PDX mouse GBM H&E samples showing differences in tumor boundaries between invasive and nodular samples. Dotted line: tumor boundary. (C) Quantification of (B) for PDX mouse GBM samples. Migration (%) = positive pixels outside tumor boundary/ positive pixels within tumor boundary. (D) UMAP of scRNA-seq data clustered by most differentially expressed genes. (E) Heatmap of genes related to tumor invasion. Red boxes highlight that nodular GBM samples have lower expression of invasion-related genes. (F) Quantification of (E). y-axis shows the mean of the normalized expression of invasion-related genes in each sample. White: invasive samples. Striped: nodular samples. (G) Dot plot showing that pathways related to cell migration and movement are significantly upregulated in invasive samples. Red: positive z-score. Blue: negative z-score. Size of circle correlates with number of significant genes in pathway.

