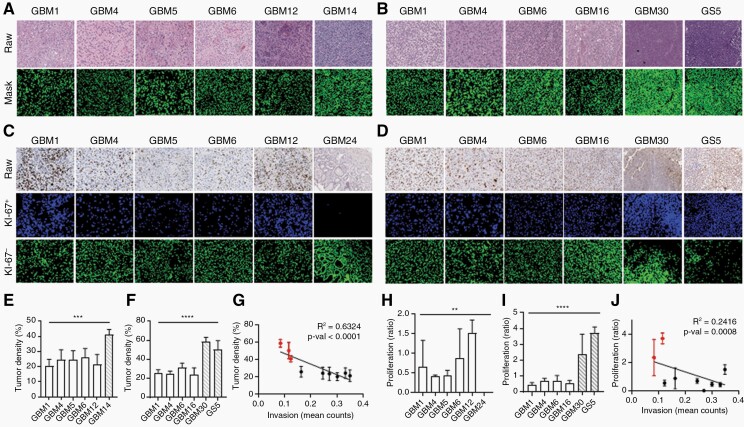
Fig. 2.
Invasive GBM has low cell density and low proliferative rate.
(A, B) H&E staining of (A) human and (B) PDX mouse GBM tissue. (Mask) Cell nuclei are shown in green. Data is reported as percent of positive pixels within a specified window. (E) Quantification of (A). (F) Quantification of (B). (G) Correlation between tumor invasion and density. (C, D) Ki-67 staining of (C) human and (D) PDX mouse GBM tissue. Data is reported as a ratio of Ki-67+ cells34 to Ki-67− cells within a specified window. (H) Quantification of (C). (I) Quantification of (D). (J) Correlation between tumor invasion and proliferation. (E, F and H, I) White: invasive samples. Striped: nodular samples. n = 5. (G, J) Red: nodular samples. Black: invasive samples.

