Figure 1.

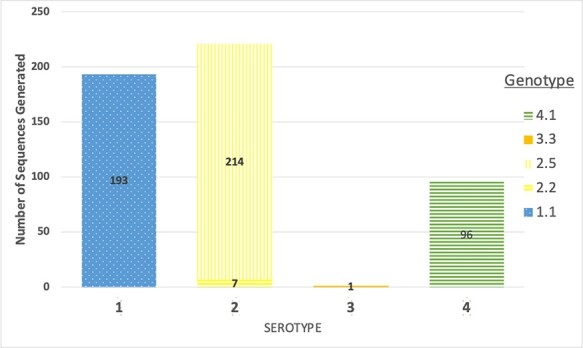
A stacked bar chart of the number of full DENV genome sequences generated during the study and their breakdown by serotype and genotype.

A stacked bar chart of the number of full DENV genome sequences generated during the study and their breakdown by serotype and genotype.