Fig. 1.
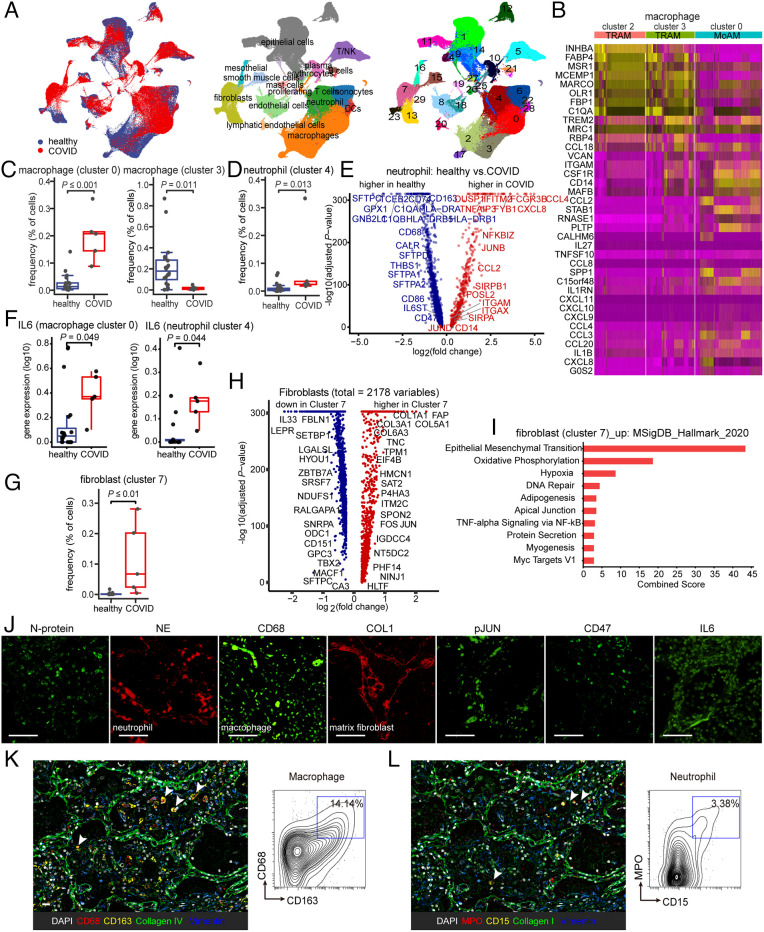
Immunological features in the lungs of COVID patients display fibrosis and innate immune activation. (A) UMAP plots demonstrating the major cell types and associated cluster in the lungs of five patients with COVID and 20 healthy lungs. Cells are colored according to donor origin, cell type classification, and clusters (for patient demographics, see Table 1). (B) Heat map comparing the expression of alveolar macrophage-related genes in two subsets of tissue-resident alveolar macrophages (TRAM, clusters 2 and 3) and one subset of monocyte-derived alveolar macrophages (MoAM, cluster 0). (C) Frequencies of macrophage subsets (clusters 0 and 3) which were presenting a significant difference between healthy and COVID cohorts. Each dot represents one individual patient. (D) The frequency of neutrophils (cluster 4) demonstrates a qualitative increase in COVID lung tissues. Each dot represents one individual patient. (E) Associations of genes with COVID status were determined using differential expression analysis for transcripts and linear regression in log-likelihood tests for neutrophil-related genes. The adjusted P values are plotted relative to the log2 fold change of the mean values between COVID and healthy lung cohorts. Blue indicates genes highly expressed in the healthy lung cohort and red genes highly expressed in the COVID lung cohort. (F) IL-6 is expressed in monocyte-derived alveolar macrophages (MoAM, cluster 0) and neutrophil (cluster 4) and in COVID lungs. Each dot represents one individual patient. (G–I) Cluster 7 represents a cluster of fibroblasts uniquely enriched in COVID which demonstrates elevated expression of AP1 and fibroblast and epithelial-to-mesenchymal transition-related genes (fibroblasts are represented in clusters 7, 13, and 23). Each dot represents one individual patient. (J) Representative confocal images of lung tissue from COVID patients demonstrate positive staining of cells for SARS-CoV-2 N-protein, as well as indicating the presence of infiltrating neutrophils and macrophages by neutrophil elastase (NE) and CD68 staining, collagen accumulation with COL1, and activation of IL-6–pJUN–CD47 axis. (Scale bar, 100 µm.) (K and L) Representative CODEX images of COVID lung tissues; selected markers collagen IV, collagen I, and vimentin indicate fibrosis, CD68, and CD163 indicate macrophage (K), and myeloperoxidase (MPO) and CD15 indicate the presence of neutrophilic/myeloid cells (L). Contour plots display the double-positive populations. (Scale bar, 100 µm.) Data are expressed as mean ± SD of five COVID lung and 20 healthy lung cohorts. Data were analyzed by the two-tailed unpaired t test; P values were labeled.

