Fig. 2.
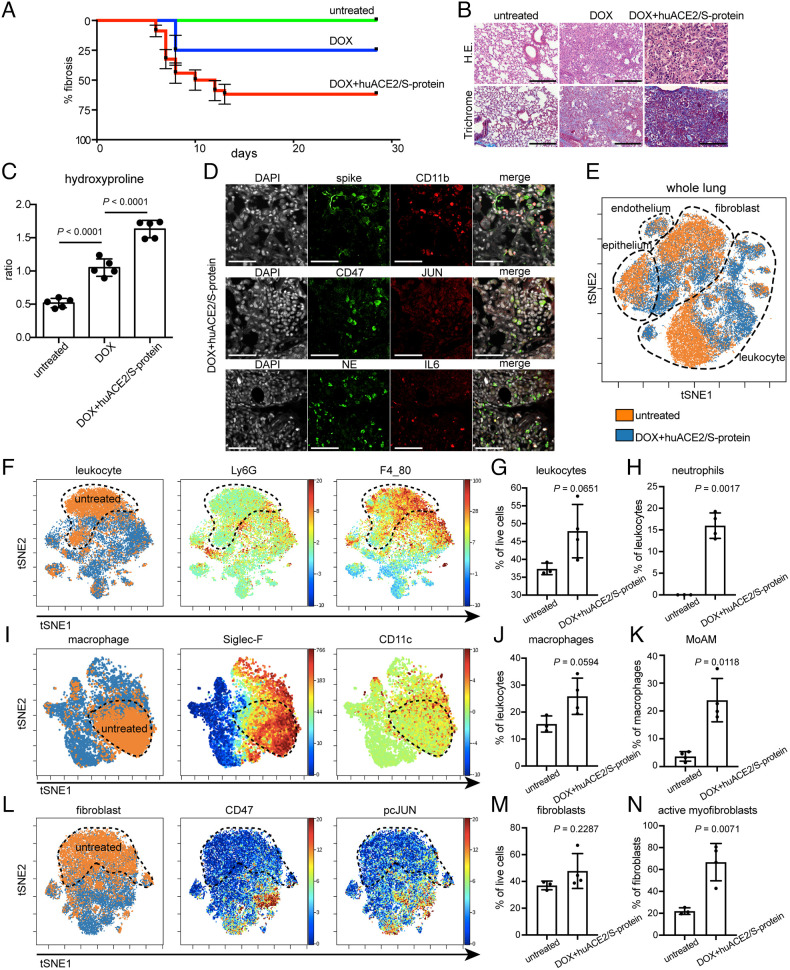
Innate immune infiltrates and fibrosis in mice indicating the transition to COVID lung fibrosis. (A) Kaplan–Meier analysis depicting onset and % fibrosis in untreated (5 mice), doxycycline-treated (5 mice), and doxycycline plus human ACE2/S-protein–treated (10 mice) mice. (B) Histology demonstrating a drastic exacerbation of lung fibrosis with combined aerosol treatment of doxycycline for JUN induction and human ACE2/S-protein compared to doxycycline aerosol alone and untreated. (Scale bar, 100 µm.) (C) Hydroxyproline assay of mouse lung tissues confirmed that the addition of human ACE2/S-protein to doxycycline for JUN induction drastically increased the fibrosis also quantitatively (P < 0.0001). 5 mice per group were analyzed. (D) Representative immunofluorescence stains demonstrate positive cells for SARS-CoV-2 spike protein, macrophages, and monocytes (CD11b), neutrophils (neutrophil elastase, NE), JUN, CD47, and IL-6. (Scale bar, 100 µm.) (E) tSNE of single-cell CyTOF data of lung tissues of 4 mice in transition to lung exposed to Dox+huACE2/S-protein (blue) and three healthy lungs (orange). (F) tSNE plots represent leukocytes in the lungs of mice in transition to COVID and healthy controls. The healthy control is labeled with a dotted line. Ly6G and F4_80 expression is used to determine the abundance of neutrophils and macrophages. (G) The statistical analysis of the frequency of leukocytes in all live cells as indicated. (H) Quantification of neutrophil frequency in the lung as indicated. (I) tSNE alignment of macrophage clusters, Siglec-F, and CD11c abundance labeling heterogeneous macrophages. (J) The abundance of lung macrophages as indicated. (K) Dot plot shows the relative contributions of monocyte-derived alveolar macrophage (MoAM) per mouse. (L) tSNE of CyTOF profiling protein expression in fibroblasts as indicated. (M) Dot plots of percentages of fibroblast gated on live cells as indicated. (N) Activated myofibroblasts were drastically increased in the mouse lungs in transition to COVID. (Scale bar, 100 µm.) Data are expressed as mean ± SD of four mouse lungs in transition to COVID and three healthy control lungs. Data were analyzed by one-way ANOVA (C) and the two-tailed unpaired t test (G, H, J, K, M, and N); P values are indicated and deemed statistically significant if P < 0.05.

