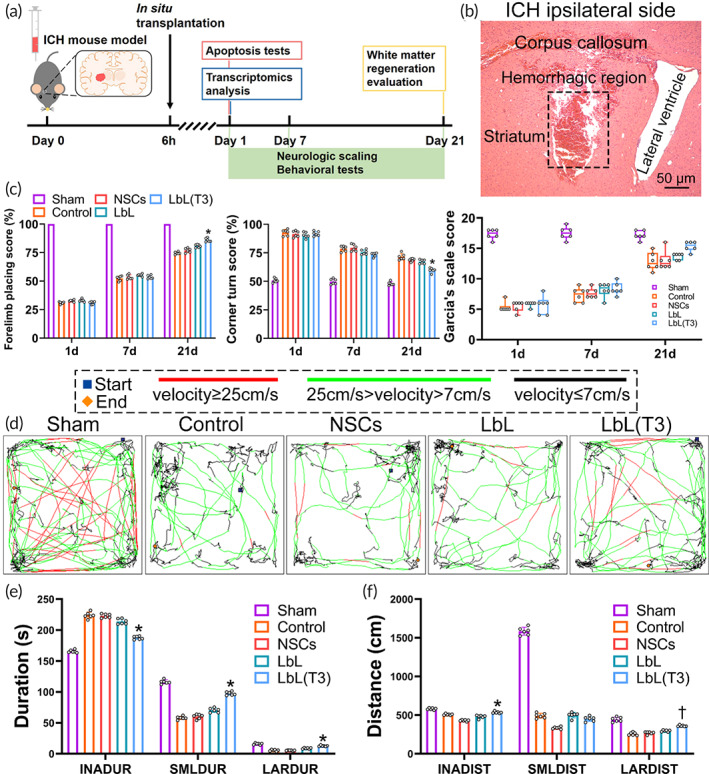
FIGURE 4.

Functional recovery of intracerebral hemorrhage (ICH) mice in different groups. (a) Timeline of the research design. (b) H&E staining of brain slices in ICH. The framed region indicates the hematoma. (c) Mice from sham, control, neural stem cell (NSC), LbL, and LbL(T3) groups were assessed with a corner turn test on Days 1, 7 and 21. *p < 0.01 when LbL(T3) versus control, NSC or LbL groups (n = 6). Mice from different groups were assessed with forelimb placing test. *p < 0.01 when LbL (T3) versus control, NSC or LbL groups (n = 6). Mice from different groups were scored with Garcia's scale. *p < 0.05 when LbL (T3) versus control, NSC or LbL groups (n = 6). (d) Tracking paths of mice in open field tests. On Day 21, mice from the sham, control, NSC, LbL, and LbL(T3) groups were placed in the open field apparatus, and their movement paths within 5 min were tracked. Blue and orange squares indicate the starting and ending positions. Lines with different colors represent different speeds. (e) Durations (segmented as “inactivity,” “small,” and “large”) of different groups were calculated in locomotion tracking. *p < 0.05 when LbL (T3) versus control, NSC or LbL groups (n = 6). (f) Distances (segmented as “inactivity,” “small and “large”) were calculated. *p < 0.05 when LbL (T3) versus NSC; †p < 0.05 when LbL (T3) versus control, NSC or LbL groups (n = 6)
