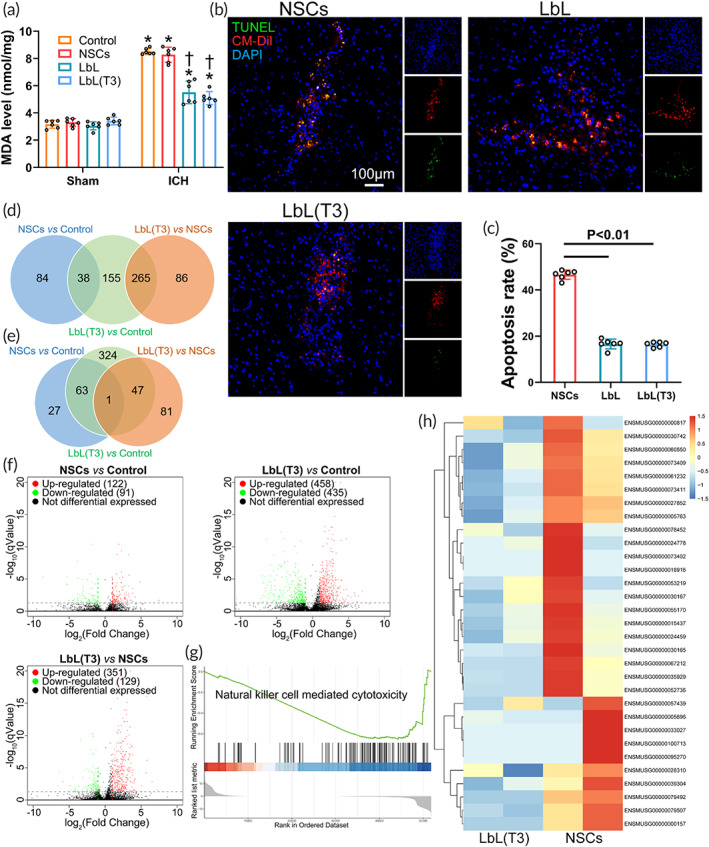
FIGURE 5.

Protective effect of the nanogel on neural stem cells (NSCs) following transplantation. (a) Perihematoma tissue in the control, NSC, LbL, and LbL(T3) groups was collected to measure the peroxidation level with an malondialdehyde (MDA) assay. Tissue in the corresponding regions from the above groups was also collected from sham animals. *p < 0.01 when control (ICH) versus control (Sham), NSCs (ICH) versus NSCs (Sham), LbL (ICH) versus LbL (Sham) and LbL(T3) (ICH) versus LbL(T3) (Sham); †p < 0.01 when LbL versus control or NSCs (ICH animals); LbL(T3) versus control or NSCs (ICH animals) (n = 6). (b) Transplantation of CM‐Dil‐labeled NSCs, LbL nanogels, and LbL(T3) nanogels was performed in intracerebral hemorrhage (ICH) mice. After 24 h, brain samples were obtained to perform terminal deoxynucleotidyl transferase dUTP nick end labeling (TUNEL) apoptosis staining. The apoptosis rate was calculated in (c) (n = 6). (d) Venn diagram of co‐upregulated genes in different groups. (e) Venn diagram of co‐downregulated genes in different groups. (f) Volcano plots of gene expression in different groups. (g) Gene set enrichment analysis (GSEA) for the LbL(T3) and NSC groups. Natural killer cell‐mediated cytotoxicity was significantly suppressed in the LbL(T3) group. (h) Expression of genes from the natural killer cell‐mediated cytotoxicity pathway from the two groups
