FIGURE 7.

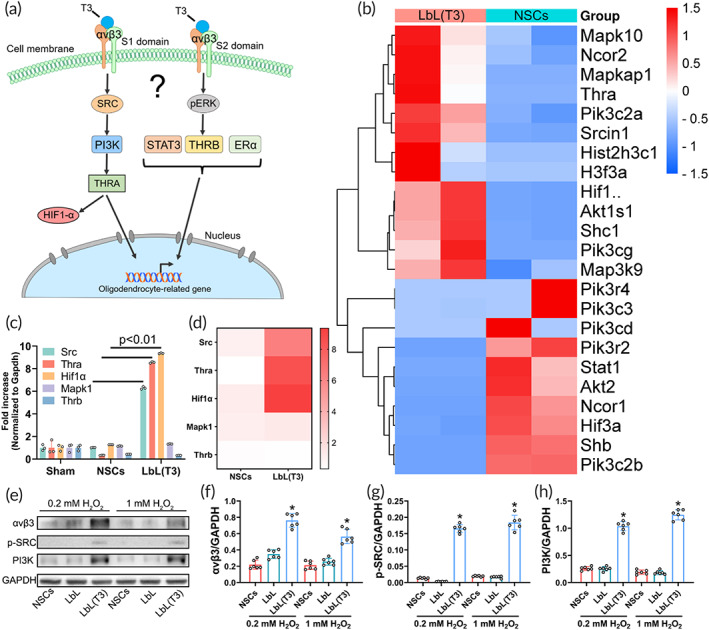
Signaling pathway involved in T3‐stimulated oligodendrogenesis. (a) Scheme of the pathways that T3 might activate in oligodendrogenesis. (b) Perihematoma tissues obtained from intracerebral hemorrhage (ICH) mice receiving neural stem cells (NSCs) and LbL(T3) were examined by transcriptome analysis. A heatmap of T3 pathway‐related gene expression is shown. (c) Real‐time qPCR of hallmark genes in the THRA and THRB pathways; the heatmap is depicted in (d). *p < 0.01 for the expression of Src, Thra, and Hif1α in the LbL(T3) group versus those in the NSC group (n = 3). (e) WB of cell samples from NSC, LbL, and LbL(T3) groups with treatments of 0 or 0.2 mM H2O2 and antibodies against αvβ3, p‐SRC and PI3K were used. (f)–(h) Quantification of WB in (e). *p < 0.01 when LbL(T3) versus NSCs or LbL (n = 6)
