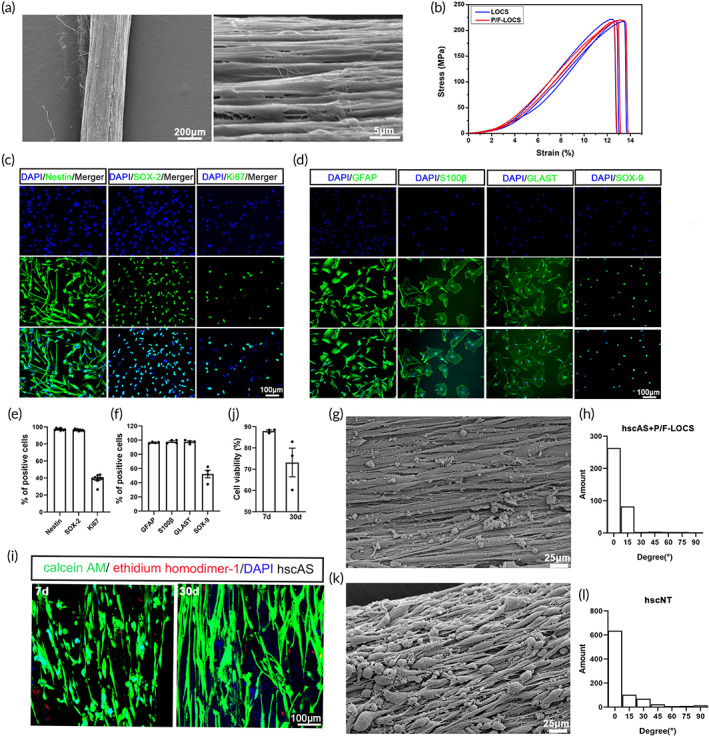
FIGURE 1.

Construction of the hscNT. (a) SEM image showing the linearly ordered structure of the P/F‐LOCS. (b) Stretching stress at various stretching strains for the LOCS and P/F‐LOCS. (c) hscNPCs mainly expressed the stem cell markers Nestin and SOX‐2 and the proliferation marker Ki67. (d) Cultured hscAS expressed astrocyte markers (GFAP, S100β, GLAST and SOX‐9). (e,f) Bar graph showing percentages of cells positive for the different markers (hscNPCs, n = 9 images; hscAS, n = 4 images). (g) Representative image of hscAS residing on P/F‐LOCS. (h) Statistical analysis of the directionality of hscAS (n = 6 images). (i) Viability assays of hscAS on the P/F‐LOCS (green, live; red, dead). (j) Quantification of hscAS viability (n = 3 images). (k) SEM image of the hscNT. (l) Statistical analysis of the directionality of total neurites of the cells cultured on the hscNT (n = 6 images). Error bars represent standard error.
