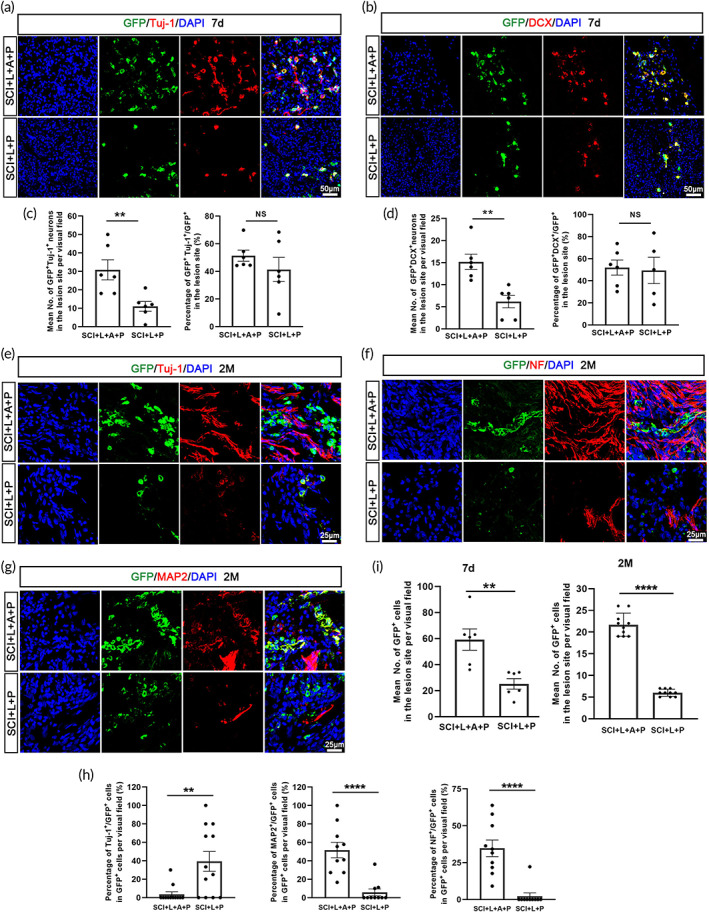
FIGURE 5.

The hscNT promotes cell survival and neuronal maturation in the lesion center. (A and B) hscNPCs differentiate into neurons expressing the immature neuron markers Tuj‐1 (a) and DCX (b) at 7 days. (c) Bar chart showing the percentage of Tuj‐1+/GFP+ and DCX+/GFP+ cells among all GFP+ cells in the two groups at 7 days. (d) Bar chart showing the numbers of Tuj‐1+/GFP+ and DCX+/GFP+ cells in the two groups at 7 days (n = 6 images). (e,g) Immunofluorescence staining images showing Tuj‐1+ immature neurons (e) and NF+ (f) and MAP2+ (g) mature neurons in the injury center at 2 months. (h) Quantification of the percentage of Tuj‐1+/GFP+, NF+/GFP+ and MAP2+/GFP+ cells among all GFP+ cells in the SCI + L + P and SCI + L + P + A groups at 2 months (n = 10 images). (i) Quantification of the numbers of grafted GFP+ cells in the lesion center at 7 days (n = 6 images) and 2 months (n = 10 images). Error bars represent standard error, and two‐group comparisons were analyzed using Student's t‐test. NS indicates no significant difference. *p < 0.05; **p < 0.01; ***p < 0.001; ****p < 0.0001.
