
FIGURE 2.
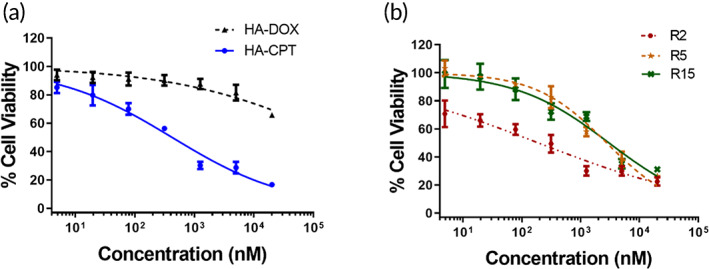
Cell viability in response to HA‐drug conjugates, including (a) HA‐CPT, HA‐DOX, and (b) R2, R5, and R15. R represents the molar ratio of DOX and CPT in the DOX‐HA‐CPT. Data correspond to mean ± SEM of three separate experiments.
Official websites use .gov
A
.gov website belongs to an official
government organization in the United States.
Secure .gov websites use HTTPS
A lock (
) or https:// means you've safely
connected to the .gov website. Share sensitive
information only on official, secure websites.
Cell viability in response to HA‐drug conjugates, including (a) HA‐CPT, HA‐DOX, and (b) R2, R5, and R15. R represents the molar ratio of DOX and CPT in the DOX‐HA‐CPT. Data correspond to mean ± SEM of three separate experiments.