Fig. 4.
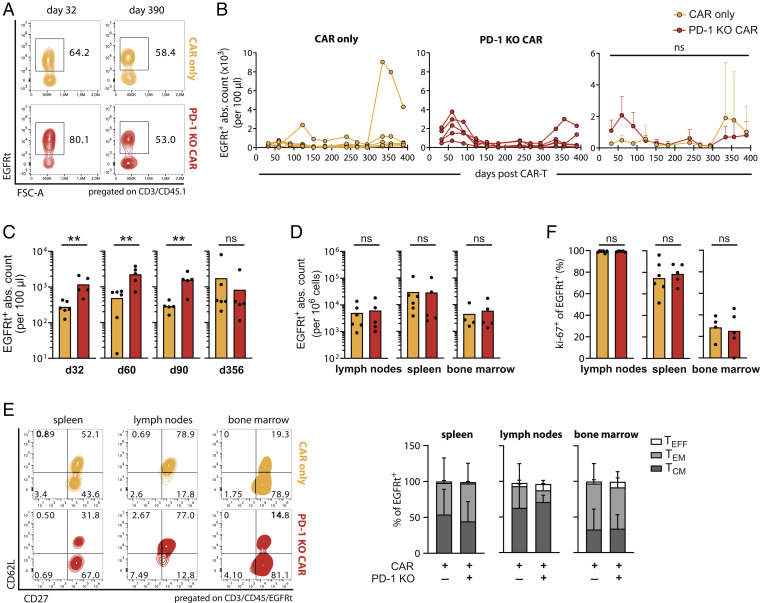
Persistence and differentiation of CAR-T cells over 390 d. (A) Representative flow cytometry plots showing CAR-T cell (EGFRt+) frequencies of transferred cells (CD3+CD45.1+) in the peripheral blood at the indicated time points after T cell injection. Mice belong to the experiment of Fig. 3 A–E. (B) Longitudinal quantification of CAR-T cell counts (EGFRt+) in individual mice (Left and Middle) and as mean + SD (Right). (C and D) Quantification of CAR-T cell counts (EGFRt+) in blood at the indicated time points (C) and in lymphoid tissues on day 390 (D) after T cell transfer. (E) Phenotypic analysis of tissue-recovered CAR-T cells (EGFRt+) on day 390. TCM (CD62L+ CD27+), TEM (CD62L− CD27+), TEFF (CD62L− CD27−). Representative flow cytometry plots (Left) and relative quantification of subpopulations in organs as mean + SD (Right). (F) Proliferative capacity of tissue-recovered CAR-T cells (EGFRt+). Statistical testing by two-way ANOVA (B) and Mann–Whitney test (C, D, and F), ns P > 0.05, **P ≤ 0.005.

