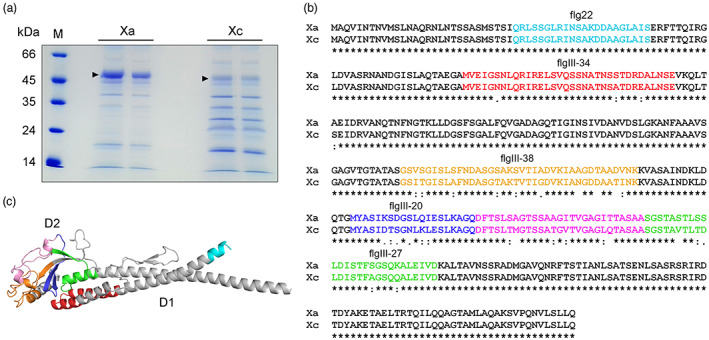
FIGURE 3.

The FliC proteins from Xanthomonas aurantifolii (Xa) and Xanthomonas citri (Xc) display several amino acid polymorphisms. (a) SDS‐PAGE of flagellum preparations showing the major approximately 50 kDa band corresponding to the FliC proteins from Xa and Xc (arrowheads). M indicates the molecular marker. (b) Protein sequence alignment performed with Clustal Omega showing that the amino acid polymorphisms between XaFliC (Xa) (GenBank accession WP_007962409) and XcFliC (Xc) (GenBank accession WP_003482972) lie outside of the flg22 region (coloured in cyan). Regions coloured in red (flgIII‐34), orange (flgIII‐38), blue (flgIII‐20), magenta, and green (flgIII‐27) represent the polymorphic peptides between the two FliC proteins. The flgIII‐34 sequence includes the Pseudomonas syringae flgII‐28 peptide. (c) Structural model of XaFliC based on the crystal structure of the Sphingomonas sp. A1 flagellin (PDB code 3K8V) showing that the corresponding polymorphic regions depicted in (b) are located mostly in the globular D2 domain
