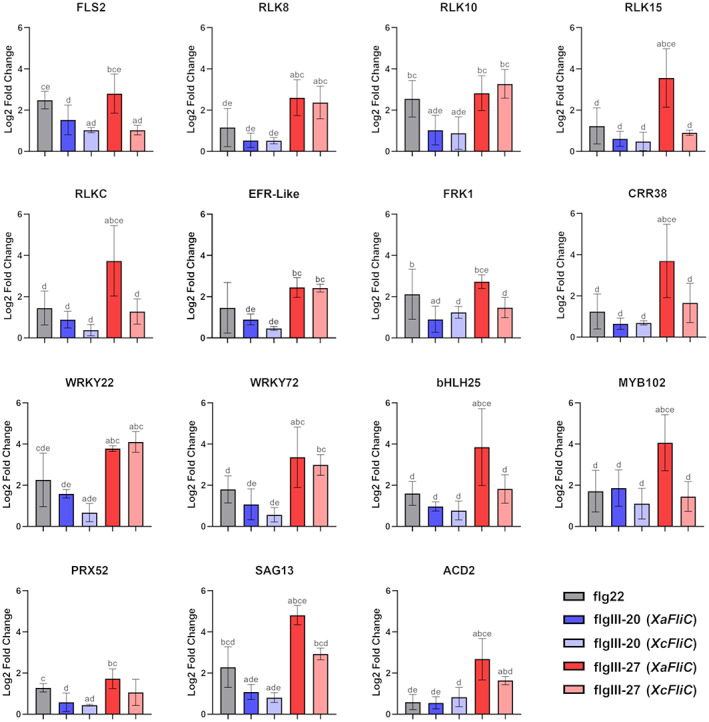
FIGURE 7.

Gene expression analysis of XaFliC‐induced genes in response to treatment with flg peptides. Reverse transcription‐quantitative PCR analysis of Natal leaves infiltrated with 70 μM flgIII‐20 or flgIII‐27 from XaFliC and XcFliC, or with flg22 or water, used as controls, 3 h postinfiltration. While flgIII‐20 did not significantly change the expression levels of most XaFliC‐induced genes, flgIII‐27 from XaFliC, but not XcFliC, specifically induced the expression of FLS2, RLK15, RLKC, FRK1, CRR38, bHLH25, MYB102, SAG13, and ACD2, relative to the water control. Error bars denote standard deviations of two independent biological samples with three technical replicates of each treatment. Statistically significant differences among the groups are indicated by the letters a, b, c, d, and e, which represent flg22, flgIII‐20 (XaFliC), flgIII‐20 (XcFliC), flgIII‐27 (XaFliC), and flgIII‐27 (XcFliC) treatments, respectively, where a indicates, for instance, that the analysed group is statistically different (p < 0.05) from the flg22 treatment group
