
FIGURE 2.
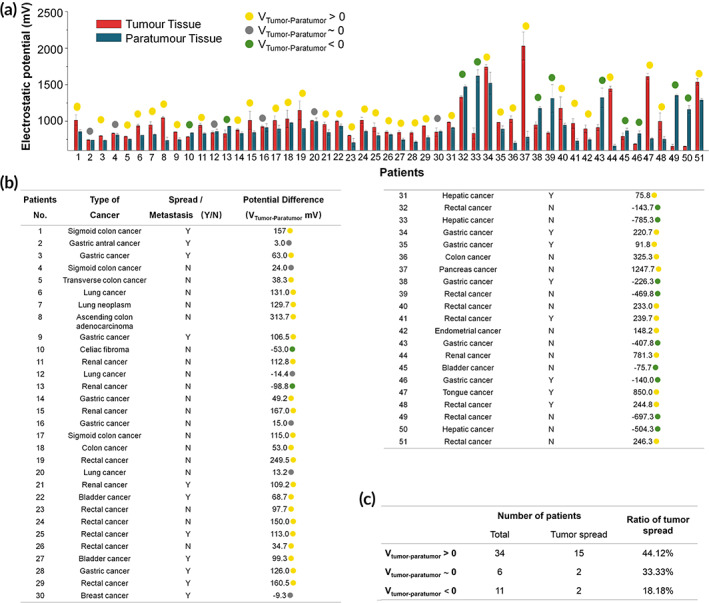
Patient sample data and electrostatic potential differences. (a, b) Electrostatic potential differences between tumor and paratumor cryosections (VTumor–Paratumor) were measured using a Kelvin probe force microscope (KFPM). Samples with a positive, negative, or negligible potential difference are denoted by yellow, green, or gray dots, respectively. Data are presented as the mean value ± standard deviation of five measurements taken at different locations. (c) Samples are grouped according to the electrostatic potential difference.