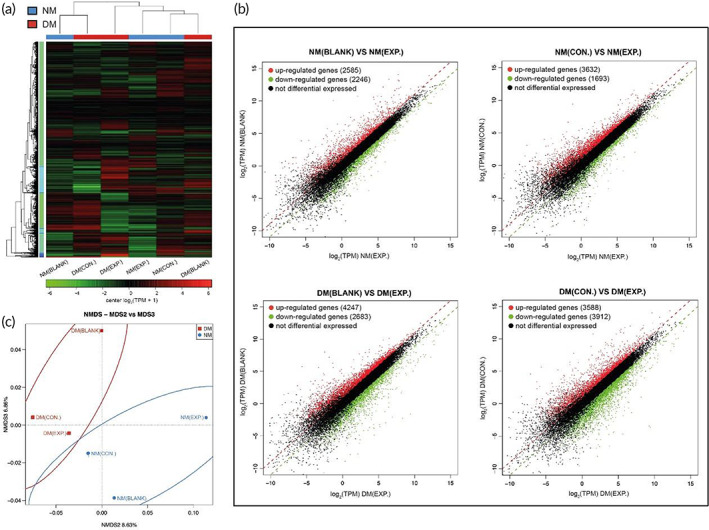
FIGURE 10.

Transcriptomics data of wound tissue in all groups on day 7. (A) Heatmap showed the differential expression of RNA sequencing data from the wound tissue in all groups. (B) Scatter map showed the differential expression of RNA sequencing data from the wound tissue in all groups. (C) NMDS analysis showed the differential expression of RNA sequencing data from the wound tissue in all groups (NM (CON.) = normal mice wound treated with HA MGs, NM (EXP.) = normal mice wound treated with HA‐LA granular gel, DM (CON.) = diabetic mice wound treated with HA MGs, DM (EXP.) = diabetic mice wound treated with HA‐LA granular gel, n = 3). HA‐LA, hyaluronic acid‐g‐lipoic acid; HA MGs, hyaluronic acid microgels; NMDS, nonmetric multidimensional scaling
