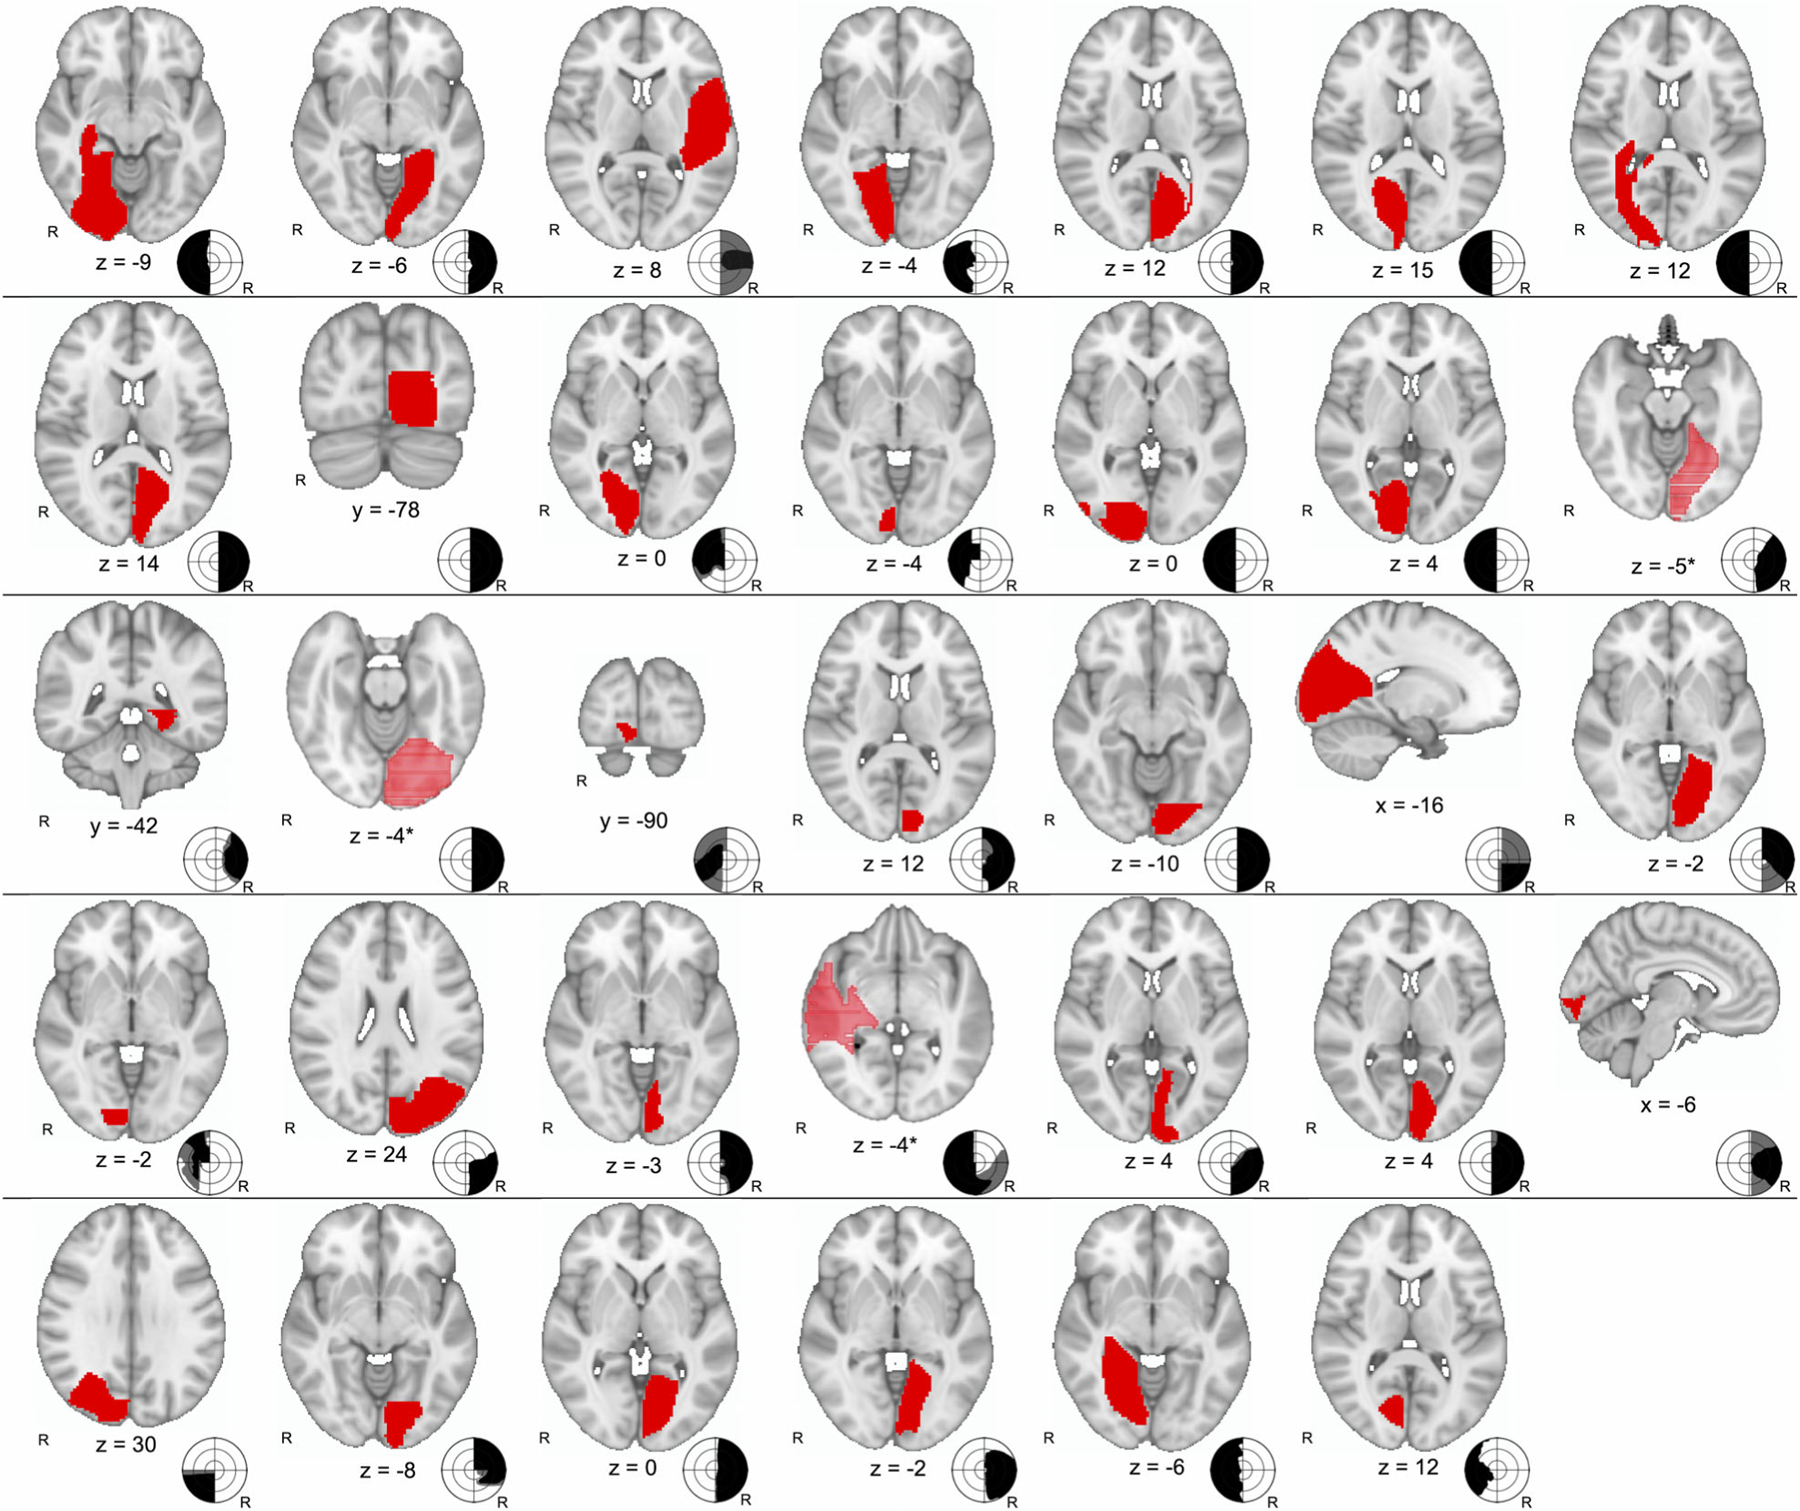
FIGURE 1:

Traced lesion locations of 34 cases of blindsight (red) with schematic drawing of visual fields. By convention, visual fields are from perspective of viewer; black area represents dense visual field loss to even the brightest stimuli, whereas gray is relative loss. Participants were tested for blindsight within area of dense vision loss. *Coordinate provided is at center of the lesion; a nonconventional orientation was used to better illustrate the extent of the lesion. R = right.
