
FIGURE 2:
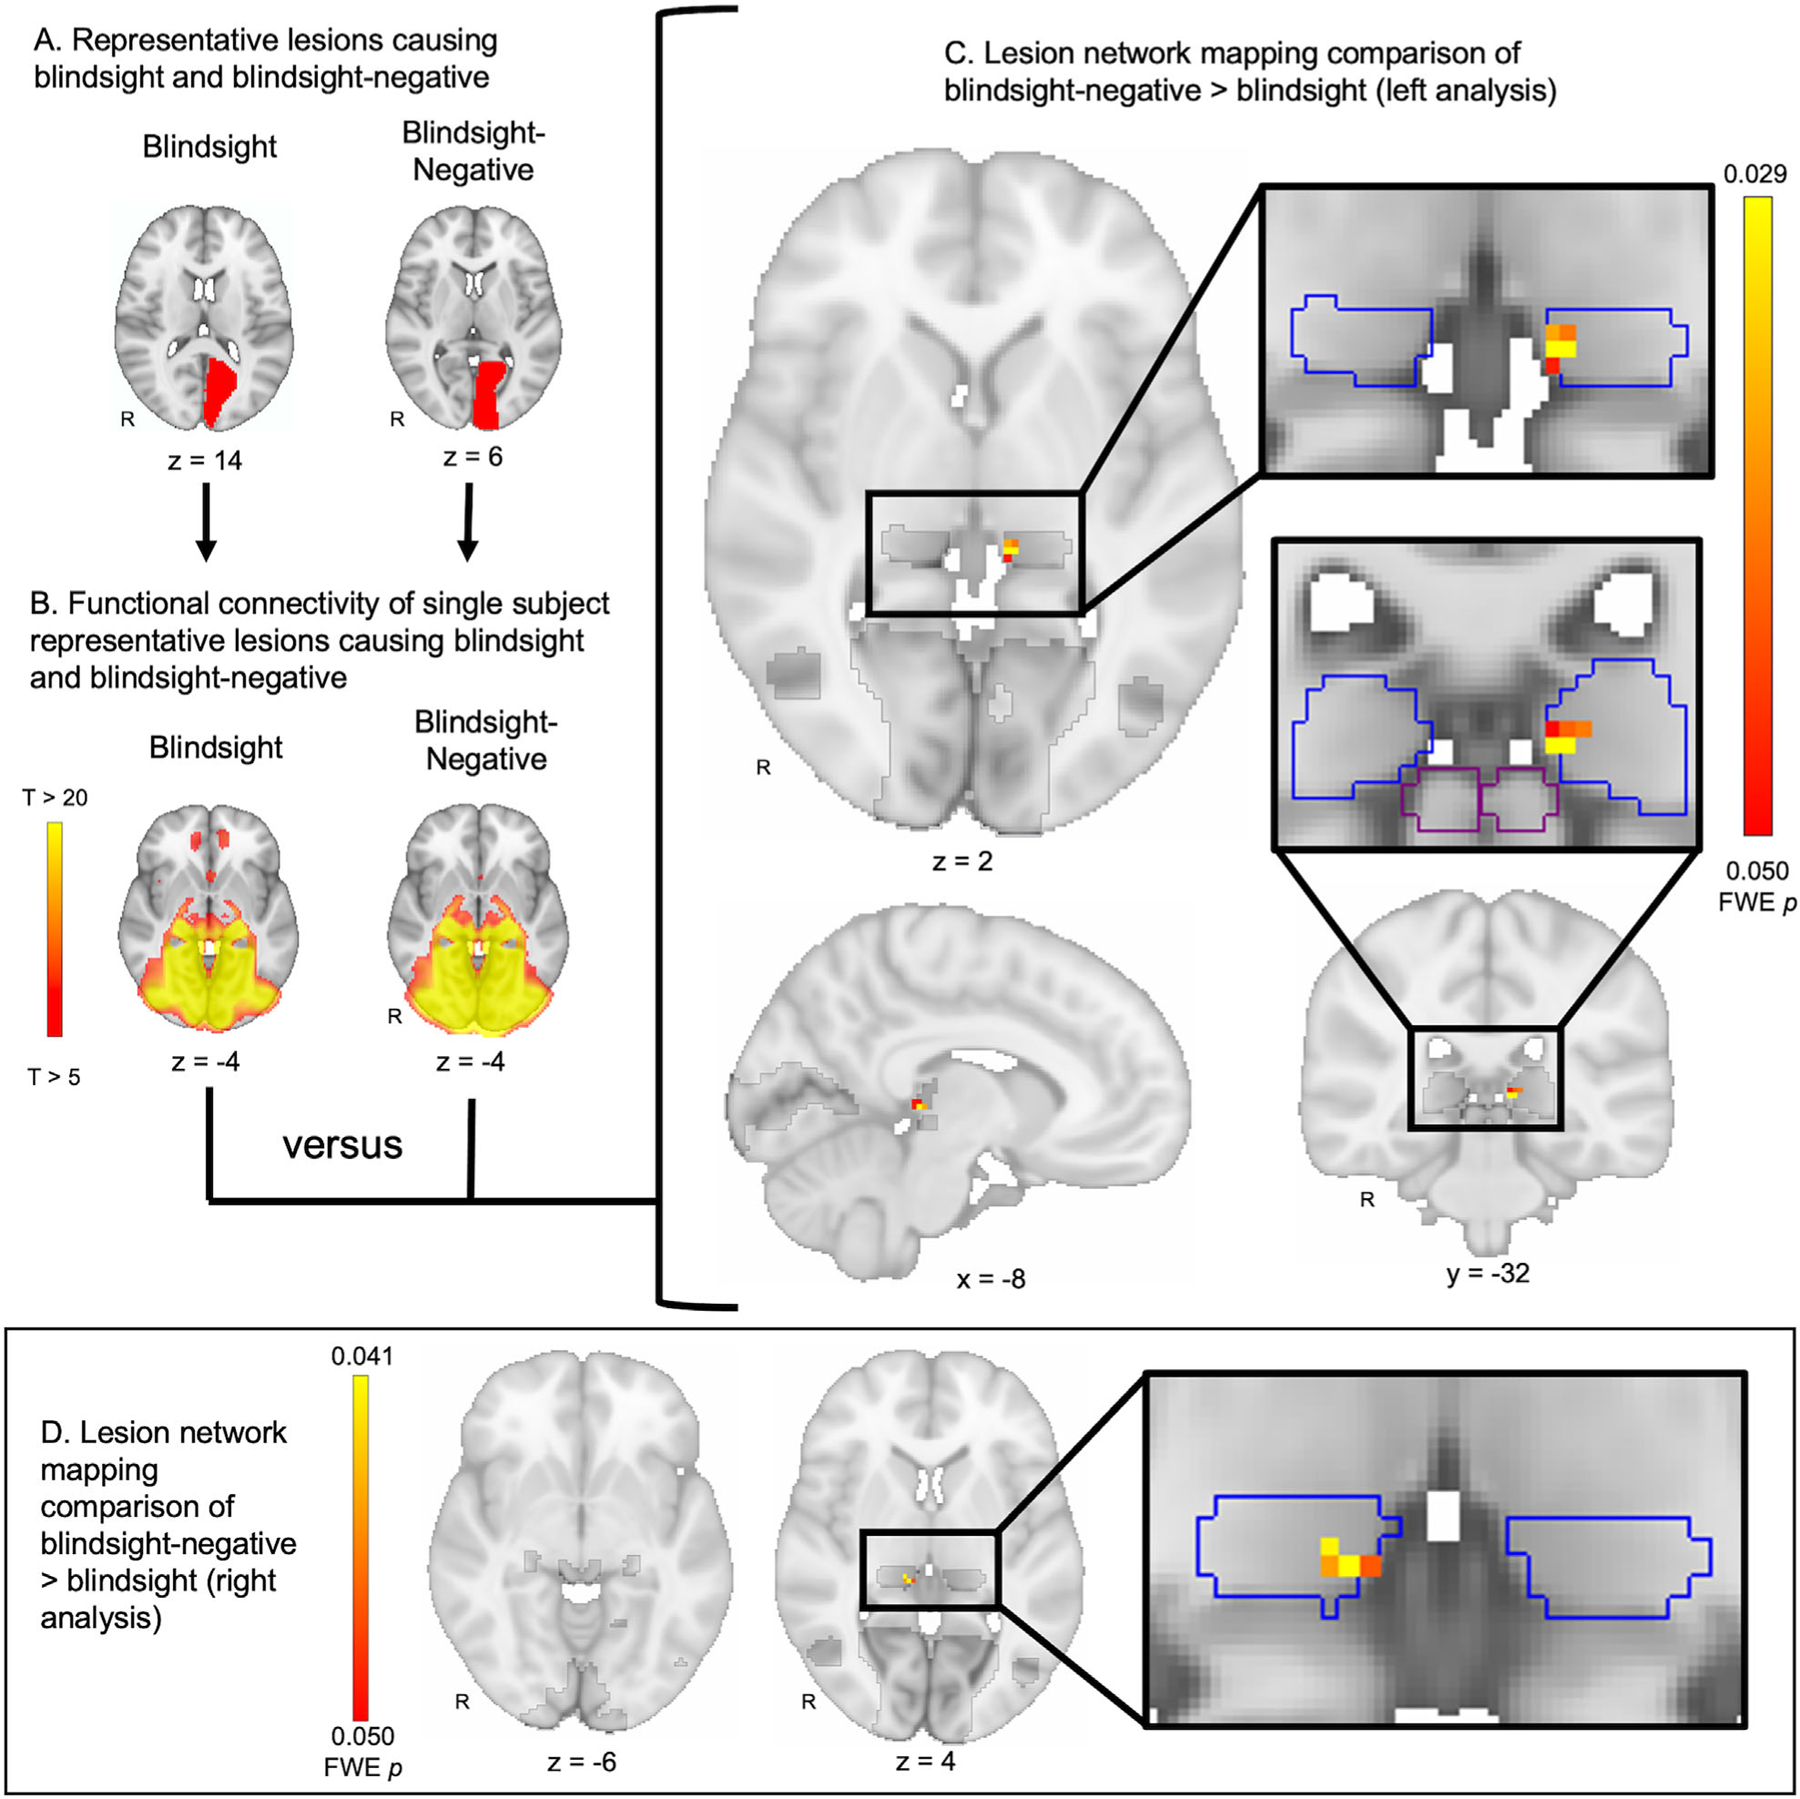
Lesion network mapping of blindsight-negative versus blindsight. (A) Representative lesion locations from a blindsight and blindsight-negative patient. Lesions were consolidated into a single hemisphere for analysis (left analysis shown). (B) Connectivity between each lesion location and the rest of the brain was computed using a normative database of resting state functional connectivity from 1,000 healthy subjects. Pictured are the connectivity patterns derived from the two representative lesion locations shown in A. (C) Connectivity differences between lesion locations from blindsight-negative (n = 35) versus blindsight patients (n = 34) were identified using a 2-sample, voxelwise t test within a mask of regions previously implicated in blindsight (dark gray). Lesions in blindsight-negative patients showed greater functional connectivity to the medial pulvinar (pulvinar in blue outline) compared to lesions in blindsight patients. No voxels in the lateral geniculate nucleus, V1, V5, or superior colliculus (outlined in purple) were identified. Images were corrected for multiple comparisons using a voxel-based family wise error (FWE) rate of p ≤ 0.05. (D) The analysis shown in A–C was repeated, but consolidating lesion locations onto the right hemisphere rather than the left hemisphere, with identical findings. R = right.