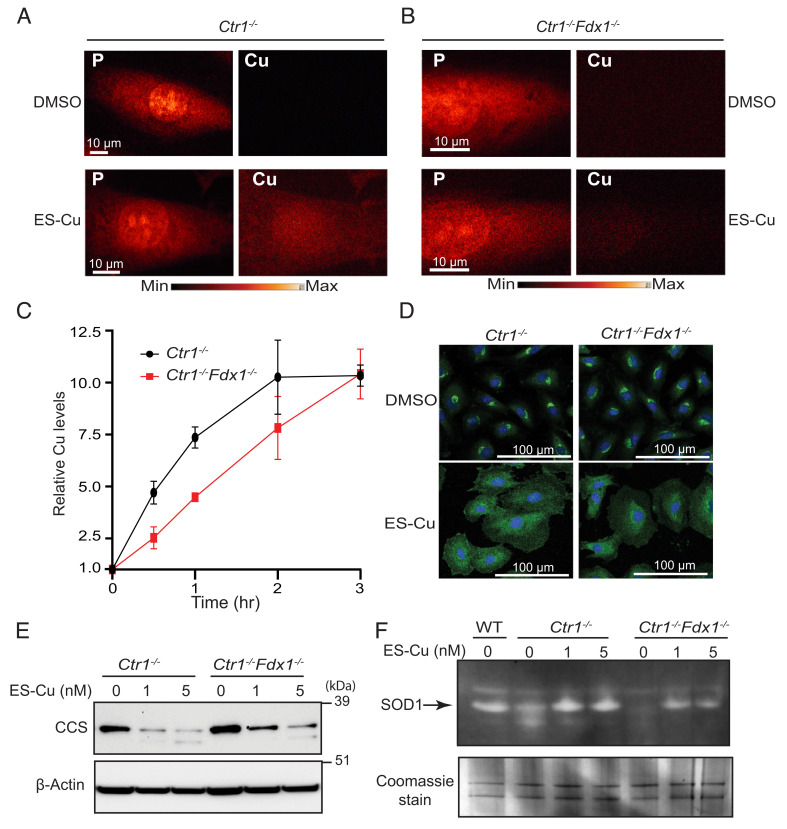
Fig. 3.
Uptake kinetics and intracellular distribution of Cu from the ES–Cu complex. (A and B) X-ray fluorescence microscopy elemental maps for phosphorus (P) and Cu in (A) Ctr1−/− and (B) Ctr1−/−Fdx1−/− cells treated with DMSO or 100 nM ES–Cu for 30 min. Elemental concentration ranges are represented by false coloring from the darkest (lowest concentration) to the brightest (highest concentration). Images are representative of two independent experiments. (C) Relative Cu accumulation in Ctr1−/− and Ctr1−/−Fdx1−/− cells treated with 100 nM ES–Cu for the indicated time intervals. Cu levels were normalized to 0 h. Data are expressed as mean ± SD, n = 3. (D) Immunofluorescence analysis of the steady-state localization and trafficking of endogenous ATP7A (green) in Ctr1−/− and Ctr1−/−Fdx1−/− cells treated with DMSO or 5 nM ES–Cu for 3 h. DAPI was used to stain the nuclei (blue). (E) SDS–PAGE/western blot analysis of CCS protein levels in the indicated cell types treated without or with 1 or 5 nM ES–Cu. β-actin was used as a loading control. (F) In-gel SOD1 activity in the indicated cell types treated with or without 1 or 5 nM ES–Cu. Coomassie stain of the same gel is used as a loading control.

