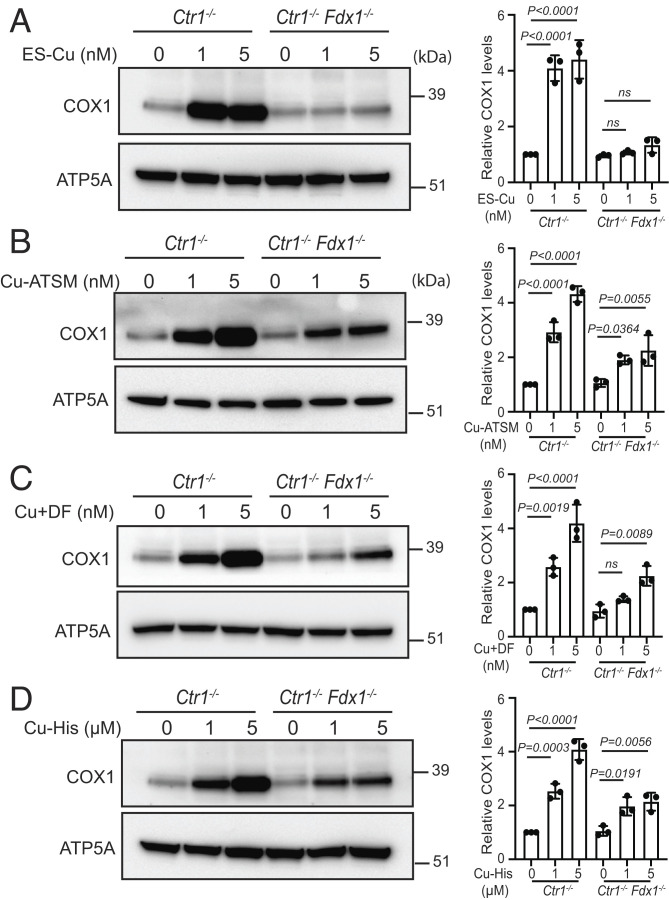
Fig. 4.
FDX1 is specific for Cu release from ES–Cu complex. Western blot analysis of COX1 protein levels in the indicated cells treated with or without (A) 1 or 5 nM ES–Cu, (B) 1 or 5 nM Cu-ATSM, (C) 1 or 5 nM CuCl2+ disulfiram, and (D) 1 or 5 µM Cu–histidine for 72 h. ATP5A was used as a loading control. The relative abundance of COX1 was quantified by densitometry analysis using ImageJ software. Data were normalized to protein levels in untreated Ctr1−/− cells and expressed as mean ± SD (n = 3). Statistical significance was assessed by one-way ANOVA with Tukey’s multiple comparison test using GraphPad Prism 9 software. ns: not significant; each dot on the bar chart represents individual data point.

