Fig. 2.
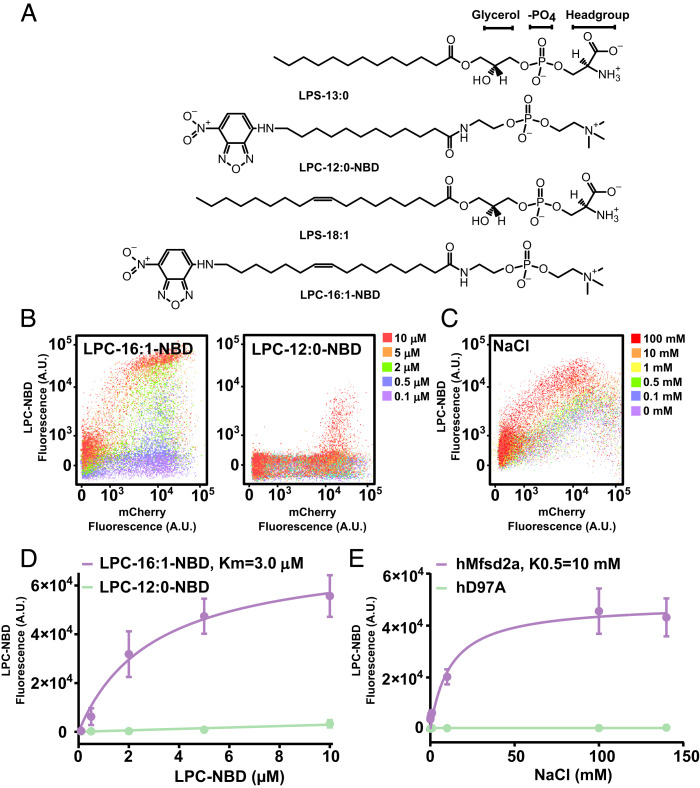
Transport parameters of LPC-NBD using a single-cell assay. (A) Chemical structures of lysolipids used in this study, LPS-13:0, LPS-18:1, LPC-12:0-NBD, and LPC-16:1-NBD. (B) Single-cell flow data for LPC-NBD (16:1 and 12:0) uptake in a dose–response setup for HEK293 cells transfected with hMfsd2a-mCherry. The LPC-NBD dose is indicated in the legend. (C) Flow data for 2 μM LPC-NBD (16:1) uptake in HEK293 cells transfected with hMfsd2a-mCherry in response to increasing concentrations of NaCl. (D) Curve fitting of data in panel B was used to derive the indicated Km for the transport of LPC-16:1-NBD. (E) Curve fitting of data in panel C. Each data point shown in D and E represents the mean ± SD.

