Fig. 3.
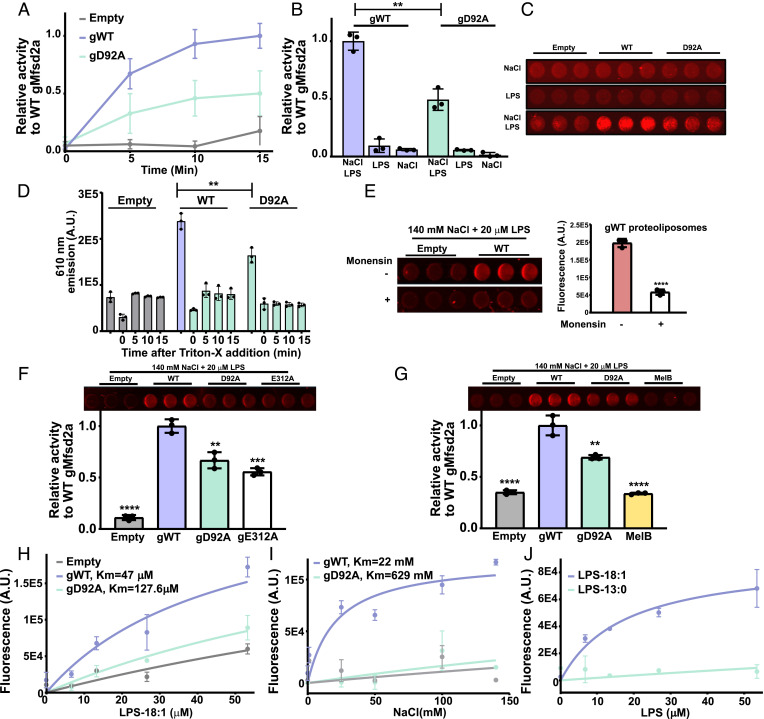
Demonstration of flippase activity in proteoliposomes. (A) Relative time-dependent activity of WT gMfsd2a (gWT), gD92A mutant, and empty liposomes (Empty). (B) Graphical representation of the 15 min timepoint shown in panel A; NaCl and LPS are added to the reactions as indicated at 140 mM NaCl and 50 μM LPS. (C) A representative image of wells from a 96-well plate at the 15 min time point shows NaCl and LPS-dependent fluorescence produced by WT gMfsd2a is greater than gD92A and empty liposomes. (D) Proteoliposomes incubated with 140 mM NaCl and 50 μM LPS for 15 min then treated with 1% Triton-X and fluorescence was quantified as a function of time. (E) Dissipation of the sodium gradient using 30 μM of monensin abolished Mfsd2a activity in proteoliposomes. Left panel showing fluorescence emitted from gWT proteoliposomes treated with and without monensin and quantified in the Right panel. (F) Comparison of activity of gWT to gD92A, gE312A, and empty liposomes at the 15 min time point using same conditions as described in panel B. Top panel showing fluorescence image of the reaction wells. (G) Comparison of gWT relative to gD92A and MelB, with Top panel showing fluorescence image of the reaction wells. (H) Dose–response experiment with indicated proteoliposomes with increasing concentrations of LPS-18:1. (I) Dose–response experiment with indicated proteoliposomes with increasing concentrations of NaCl. (J) Dose–response experiment using LPS-18:1 and LPS-13:0. All experiments were performed in technical triplicate with data represented as mean ± SD. **P < 0.005, ***P < 0.002, ****P < 0.0001.

