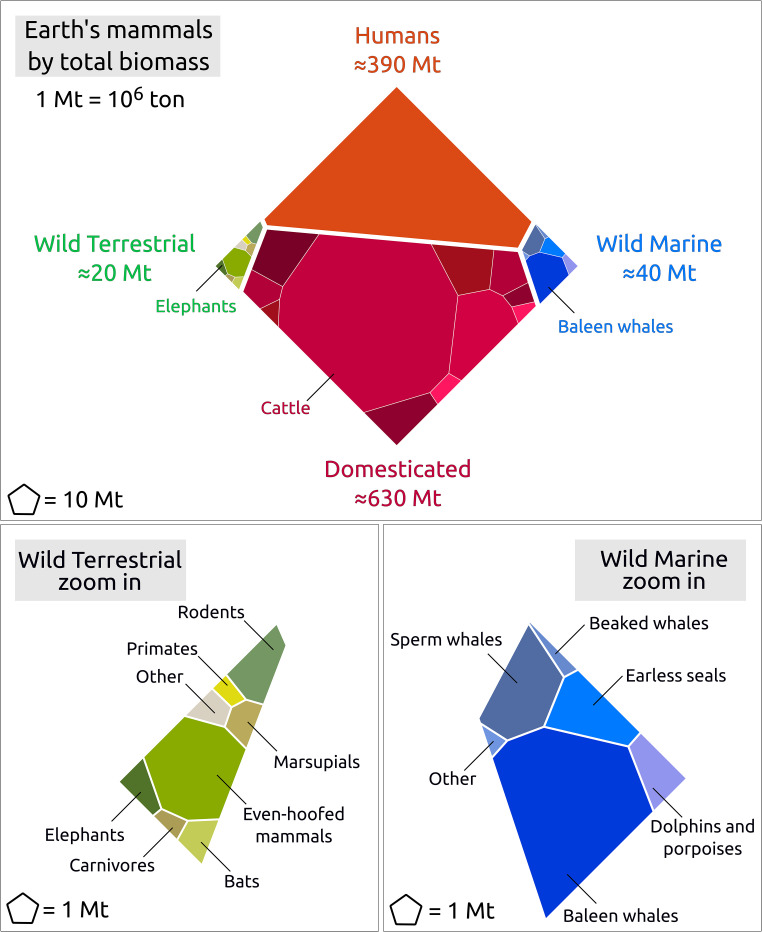
Fig. 4.
Top: the global biomass distribution of the mammalian class, represented by a Voronoi diagram. The area of each cell is proportional to the biomass contribution of each group. The global mammalian biomass distribution is dominated by humans and domesticated mammals, including livestock and pets (illustrated at the species level in SI Appendix). Bottom: enlarged view of the biomass of wild terrestrial (Left, grouped by order) and marine mammals (Right, grouped by family, or few families).

