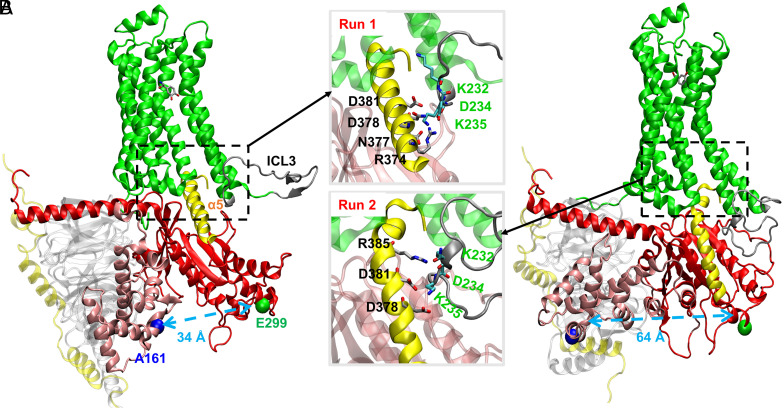
Fig. 3.
All-atom MD simulations of the active-state human β2AR–Gs with NE(+) bound based on Anton runs. (A) run 1 with the Top Inset. (B) run 2 with the Bottom Inset Final structures are captured from the 5-μs–long unbiased MD simulation runs. Individual protein chains/subunits are labeled and shown in the ribbon representation using different colors. Gsα α5 helix and β2AR intracellular loop 3 (ICL3) are colored in yellow and dark gray, respectively. Cα atoms of residues A161 on GsαAH domain and E299 on GsαRas domain are shown as blue and green balls, and distances between them are shown by light-blue dashed arrows. The quantification of the interactions between ICL3 and α5 helix can be found in SI Appendix, Table S3. The geometric centers were used for the distance measurements. The common Gα numbering (CGN) numbers (D381G.H5.13, D378G.H5.10, N377G.H5.9, R374G.H5.6, R385G.H5.17) for residues in Gsα α5 as well as A161H.HD.5 and E299G.HG.6 are omitted in the figure for clarity.

