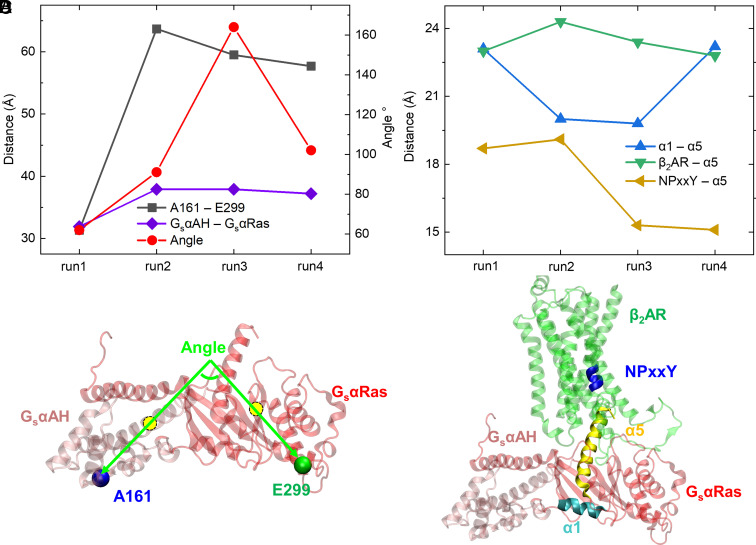
Fig. 4.
Analysis of Gsα conformation and its possible partial dissociation from β2AR based on all-atom MD Anton runs. The distances and angle shown in each run are based on their average values during the last 2 μs of MD simulations. The distances and angles were measured between geometric centers of protein residues or domains. (A) A161–E299 distances indicating Gs protein conformational change (opening or closing), GsαAH–GsαRas distances indicating relative movement between the two domains, the angle between the two vectors of GsαAH and GsαRas domains indicating their relative orientation (B) α1–α5 distances indicating relative movement between α1 and α5 helices in Gsα, β2AR–α5 distances indicating possible partial dissociation of Gsα α5 helix from the receptor, and β2AR NPxxY motif–α5 helix distances also indicating Gsα α5 partial dissociation. (C) Illustration of the angle between GsαAH and GsαRas domains; vector 1 goes through GsαAH and A161 centers; vector 2 goes through GsαRas and E299 centers. (D) Illustrations of Gsα α5 helix (yellow), α1 helix (cyan), and β2AR NPxxY motif (blue helix on transmembrane domain 7).

