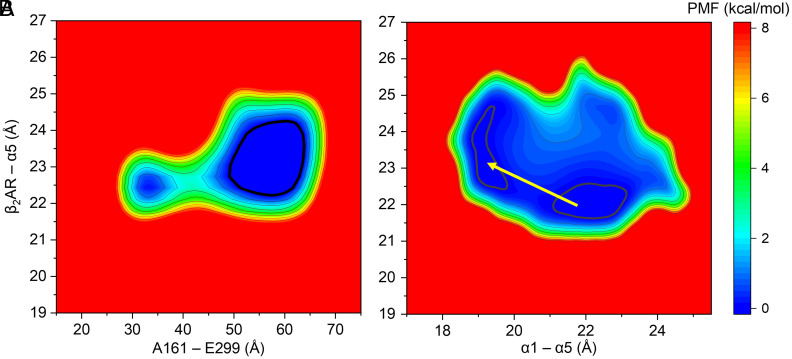
Fig. 5.
2D potential of mean force (PMF) or free energy profiles (in kcal/mol) based on Gsα conformation and its possible partial dissociation from β2AR based on all-atom Anton MD simulations of the active state of the human β2AR–Gs complexes with NE(+). The 0.5 kcal/mol contour lines are shown as bold black curves. Relative free energy values from 0 to 8 kcal/mol are indicated by different colors from blue to red. All distances were measured between geometric centers of protein residues or domains. (A) A161–E299 distance indicating Gsα opening or closing is shown as X-axis; distance between Gsα α5 and β2AR indicating possible partial Gs dissociation is shown as Y-axis. (B) Gsα α1–α5 distance is shown as X-axis; distance between Gsα α5 and β2AR is shown as Y-axis. The contour lines are smoothed for better visualization.

