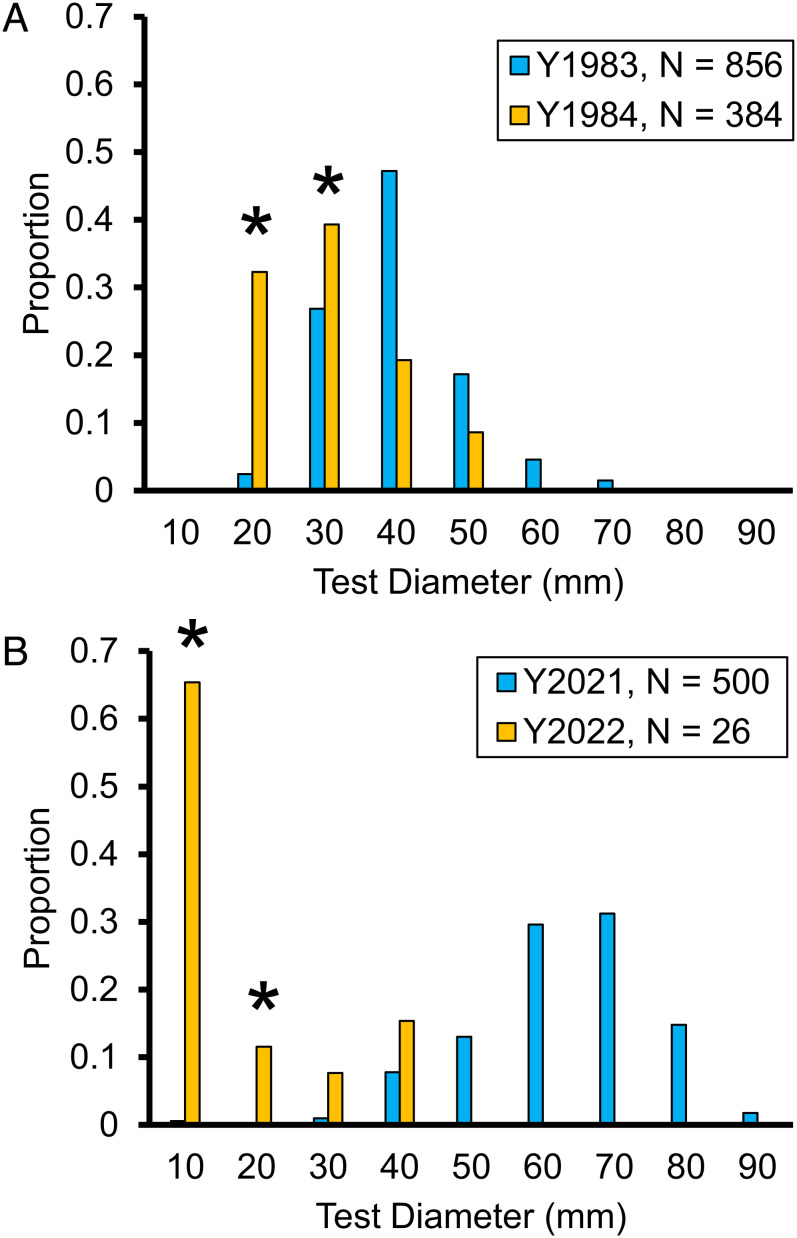
Fig. 3.
Size–frequency distribution of D. antillarum test diameter pre- and post- the first (A) and second (B) mass mortality events. The 1984 and 2022 surveys were 7- and 5-mo postmortality, respectively. Most individuals following the 2022 event were likely recruited following the mortality event (asterisks). Proportions are plotted to visualize shifts in size distribution and do not reflect density differences among years.

