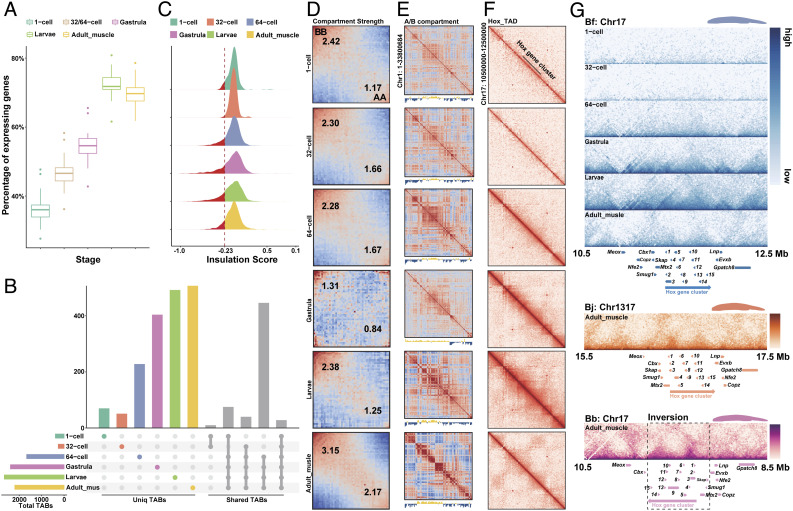
Fig. 4.
Developmental dynamics of amphioxus chromatin architecture. (A) The percentage of actively transcribed genes (TPM > 1) across five developmental stages of 1-cell zygote, 32-/64-cell, gastrula, larvae, and adult muscle tissues of Bf. (B) The number of TABs at 5 kb resolution across six developmental stages of Bf. The horizontal bars show the number of TABs of each stage. The vertical colored bars show the number of specific TABs of each stage, and the grey bars show the number of shared TABs among six stages. (C) The distribution of insulation scores of TABs across different stages. The smaller the insulation score is, the higher strength the TAB has. (D) Saddle plots of amphioxus Hi-C data binned at 250 kb resolution at six different developmental stages. Bins are sorted by their PC1 value. B-B (inactive-inactive) interactions are in the upper left corner, and preferential A-A (active–active) interactions are in the lower right corner. Numbers in the corners show the strength of AA interactions as compared to AB interaction and BB interactions against BA interactions. (E) Correlation matrix and eigenvector 1(PC1) values value tracks for amphioxus chromosome 1 at 250 kb resolution at six different developmental stages. (F) Distribution of interaction at 15 kb resolution at the Bf Hox cluster. (G) Distribution of TADs at the 15 kb resolution in three different amphioxus Hox regions with the gene tracks.

