Fig. 3.
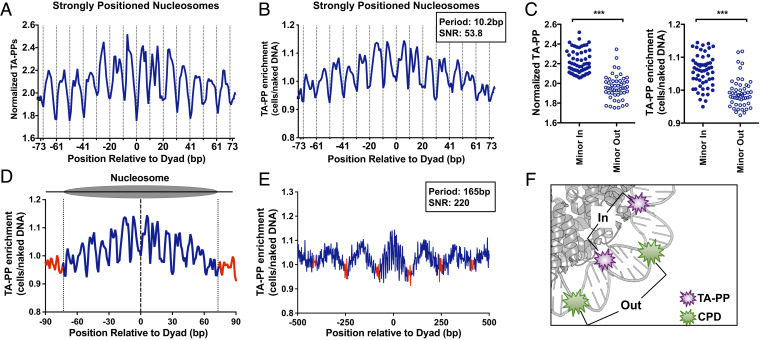
TA photoproducts show a unique pattern of damage formation in nucleosomes. (A) Rotational periodicity of cellular TA-PPs within all (~10,000) strongly positioned yeast nucleosomes (29). Data plotted as number of UVDE-seq reads at TA sequences normalized by the number of TA dinucleotides. Dashed lines correspond to outward rotational settings. (B) Rotational periodicity of TA-PP enrichment (TA-PP in UV-irradiated cells relative to the UV-irradiated naked DNA control) in strongly positioned yeast nucleosomes (29). Peak periodicity of TA-PP enrichment and its signal-to-noise ratio (SNR) are indicated. (C) Normalized TA-PP (Left) and TA-PP enrichment (Right) are elevated at inward rotational settings relative to outward rotational settings. Rotational settings derived from a previous study (32). ***P < 0.0001, based on Mann–Whitney test. (D) Translational periodicity of normalized TA-PPs in nucleosomal (blue) and linker DNA (red) in ~10,000 strongly positioned nucleosomes (29). Dashed lines at −73 and +73 represent the border between nucleosomal and linker DNA. (E) Translational periodicity of TA-PPs across multiple yeast nucleosomes, with a 1,000-bp window centered on each strongly positioned nucleosome. TA-PP enrichment from UV-irradiated cells is depicted. Regions of linker DNA are shown in red. Peak translational periodicity of TA-PPs, and its SNR are indicated. (F) Model showing TA-PP formation (purple explosion) is elevated at inward rotational settings, while CPD formation (green explosion) is elevated at outward rotation settings in nucleosomes. Nucleosome image was generated from PDB ID 1id3 and visualized using PyMOL.

