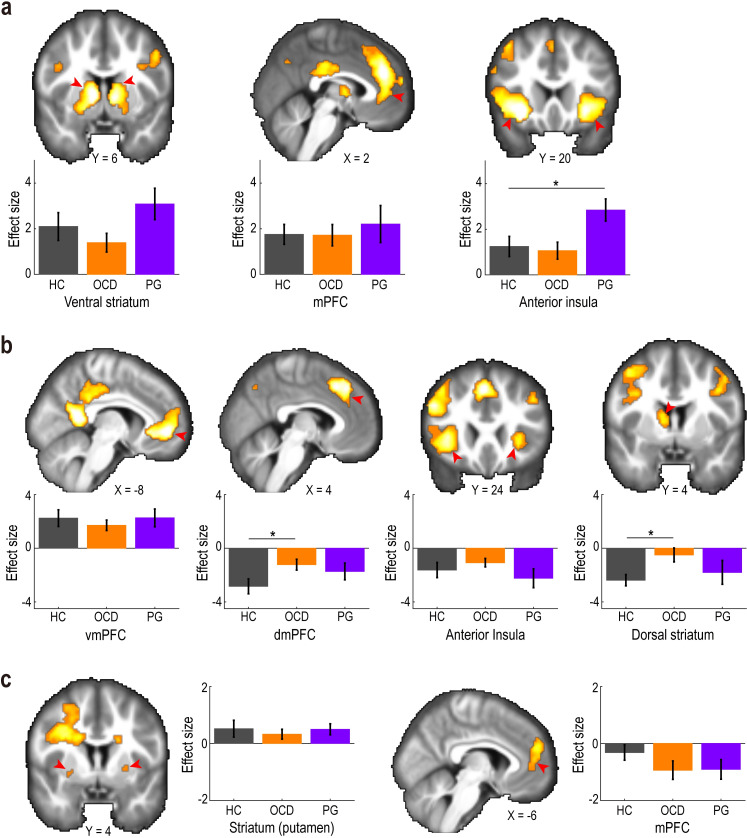
Fig 6. Neural correlates of reward prediction errors.
(a) Positive reward prediction error in the reward trials. The activation maps are thresholded at P < 0.0005 (uncorrected) for display purposes. Red arrows indicate regions of interest. Bar-plots show effect sizes of the positive reward prediction error in the HC, OCD, and PG groups (mean ± SEM). Grey, healthy control (HC); orange, obsessive-compulsive disorder (OCD); purple, pathological gambling (PG). *P < 0.05 in a two-tailed Welch’s t test, Bonferroni-corrected for the two tests performed. mPFC, medial prefrontal cortex. (b) Negative prediction error in the reward trials. vmPFC, ventromedial prefrontal cortex; dmPFC, dorsomedial prefrontal cortex. The format is the same as in (a). (c) Unitary reward prediction error in the avoidance trials. The format is the same as in (a). Summary data to reproduce the figure are available at https://osf.io/v7em5/.

