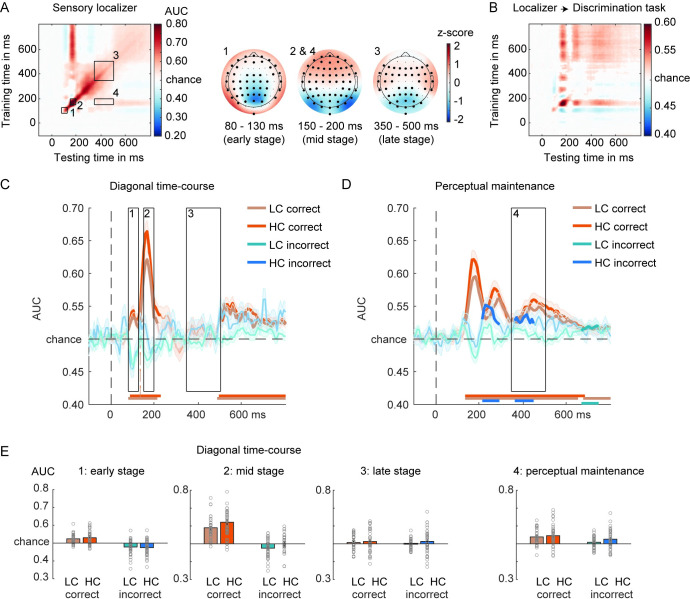
Fig 4. Face/house classification based on the sensory localizer.
(A) GAT matrix for the sensory localizer (all electrodes) and ROI marked by inset black boxes (numbers 1–4). On the right, covariance/class separability maps for each diagonal ROI, indicating the underlying data contributing to the classification performance. Highlighted channels significantly contributed to the classification performance after cluster-based permutation testing over channels (corrected for multiple comparisons). Covariance/class separability maps 2 and 4 are the same because decoding scores within insets 2 and 4 were obtained using the same training time-window. (B) Classifiers trained on the sensory localizer applied to the main discrimination task (cross-task validation procedure, all electrodes). (C) On-diagonal and (D) off-diagonal time courses of correct and incorrect decisions, separated by confidence. Black boxes indicate the time-windows (early, mid, late) used for averaging the AUC scores. Colored horizontal lines indicate periods of significant decoding with respect to chance. Longer-lasting sensory traces are derived by training a classifier on the time-window 150–200 ms and testing it across the entire time-window (panel D). Classification performance was evaluated at each time point using cluster-based permutation testing (two-tailed cluster-permutation, alpha p < 0.05, cluster alpha p < 0.05, N permutations = 1,000). (E) Bar plots show average AUC values for the TOI highlighted in panels (C) and (D). The underlying data and scripts supporting this figure can be found on FigShare (https://doi.org/10.21942/uva.c.6265233.v1). AUC, area under the curve; GAT, generalization across time; HC, high confidence; LC, low confidence; ROI, regions of interest; TOI, time-windows of interest.

