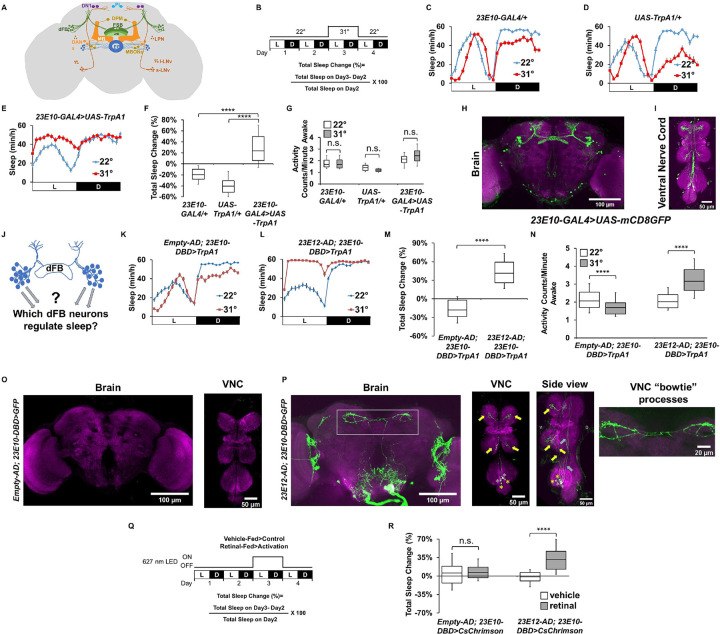
Fig 1. The 23E10-GAL4 driver contains non-dFB sleep-promoting neurons.
(A) Cartoon depicting known sleep-regulating centers in the fly brain. (B) Diagram of the experimental assay. Sleep was measured at 22°C for 2 days to establish baseline sleep profile. Flies were then shifted to 31°C for 24 h at the start of day 3 to increase activity of the targeted cells by activating the TrpA1 channel and then returned to 22°C. White bars (L) represent the 12 h of light and black bars (D) represent the 12 h of dark that oscillate daily. (C, D) Sleep profile in minutes of sleep per hour for day 2 (22°C, blue line) and day 3 (31°C, red line) for parental control female flies: 23E10-GAL4/+ (C) and UAS-TrpA1/+ (D). (E) Sleep profile in minutes of sleep per hour for day 2 (22°C, blue line) and day 3 (31°C, red line) for 23E10-GAL4>UAS-TrpA1 female flies. (F) Box plots of total sleep change in % ((total sleep on day 3-total sleep on day 2/total sleep on day 2) × 100) for data presented in (C–E). Flies expressing UAS-TrpA1 in 23E10-GAL4 significantly increase sleep when switched to 31°C compared with parental controls, Kruskal–Wallis ANOVA followed by Dunn’s multiple comparisons. ****P < 0.0001, n = 25–31 flies per genotype. (G) Box plots of locomotor activity counts per minute awake for flies presented in (C–E). Two-way repeated measures ANOVA followed by Sidak’s multiple comparisons test found no differences in locomotor activity between 22°C and 31°C, n.s. = not significant, n = 25–31 flies per genotype. (H, I) Representative confocal stacks of a female 23E10-GAL4>UAS-mCD8GFP brain (H) and VNC, (I). Green, anti-GFP; magenta, anti-nc82 (neuropile marker). (J) Cartoon depiction of the original goal of our Split-Gal4 screen, which was to identify which dFB neurons modulate sleep. (K) Sleep profile in minutes of sleep per hour for day 2 (22°C, blue line) and day 3 (31°C, red line) for empty control (Empty-AD; 23E10-DBD>TrpA1) flies. (L) Sleep profile in minutes of sleep per hour for day 2 (22°C, blue line) and day 3 (31°C, red line) for 23E12-AD; 23E10-DBD>TrpA1 flies. (M) Box plots of total sleep change in % for female control (Empty-AD; 23E10-DBD) and 23E12-AD; 23E10-DBD flies expressing UAS-TrpA1. A two-tailed unpaired t test revealed that 23E12-AD; 23E10-DBD>TrpA1 flies increase sleep significantly more than control flies when transferred to 31°C. ****P < 0.0001, n = 44–51 flies per genotype. (N) Box plots of locomotor activity counts per minute awake for flies presented in (M). Two-way repeated measures ANOVA followed by Sidak’s multiple comparisons test found that locomotor activity per awake time is increased in 23E12-AD; 23E10-DBD>TrpA1 flies transferred to 31°C. ****P < 0.0001, n = 44–51 flies per genotype. (O) Representative confocal stacks of an Empty-AD; 23E10-DBD>UAS-mCD8GFP female brain (left panel) and VNC (right panel). Green, anti-GFP; magenta, anti-nc82 (neuropile marker). (P) Representative confocal stacks of an 23E12-AD; 23E10-DBD>UAS-mCD8GFP female brain (left panel), VNC (middle panel left), a side view of the VNC (middle panel right) as well as a magnified view of VNC “bowtie” processes in the brain as indicated by the gray rectangle. Yellow arrows indicate TPN1-like processes in the VNC. Yellow asterisks indicate TPN1-like cell bodies. Gray arrows indicate “bowtie” neurons processes in the VNC. Gray asterisks indicate “bowtie” neurons cell bodies. Green, anti-GFP; magenta, anti-nc82 (neuropile marker). (Q) Diagram of the experimental assay. Sleep was measured in retinal-fed and vehicle-fed flies for 2 days without 627 nm LED stimulation to establish baseline sleep profile. LEDs were then turned on for 24 h at the start of day 3 to increase activity of the targeted cells by activating the CsChrimson channel and then turned off on day 4. White bars (L) represent the 12 h of light and black bars (D) represent the 12 h of dark that are oscillating daily. (R) Box plots of total sleep change in % ((total sleep on day 3-total sleep on day 2/total sleep on day 2) × 100) for control (Empty-AD; 23E10-DBD) and 23E12-AD; 23E10-DBD female flies expressing CsChrimson upon 627 nm LED stimulation. Two-way ANOVA followed by Sidak’s multiple comparisons revealed that total sleep is significantly increased in 23E12-AD; 23E10-DBD>UAS-CsChrimson female flies stimulated with 627 nm LEDs when compared with vehicle-fed flies. ****P < 0.0001, n.s. = not significant, n = 24–32 flies per genotype and condition. The raw data underlying parts F, G, M, N, and R can be found in S1 Data. DANs, dopaminergic neurons; dFB, dorsal fan-shaped body; DN1, dorsal neurons 1; DPM, dorsal paired medial neurons; EB, ellipsoid body; FSB, fan-shaped body; l-LNv, large lateral neurons ventral; LPN, lateral posterior neurons; MB, mushroom body; MBONs, mushroom body output neurons; PI, pars intercerebralis; s-LNv, small lateral neurons ventral; vFB, ventral fan-shaped body; VNC, ventral nerve cord.

